
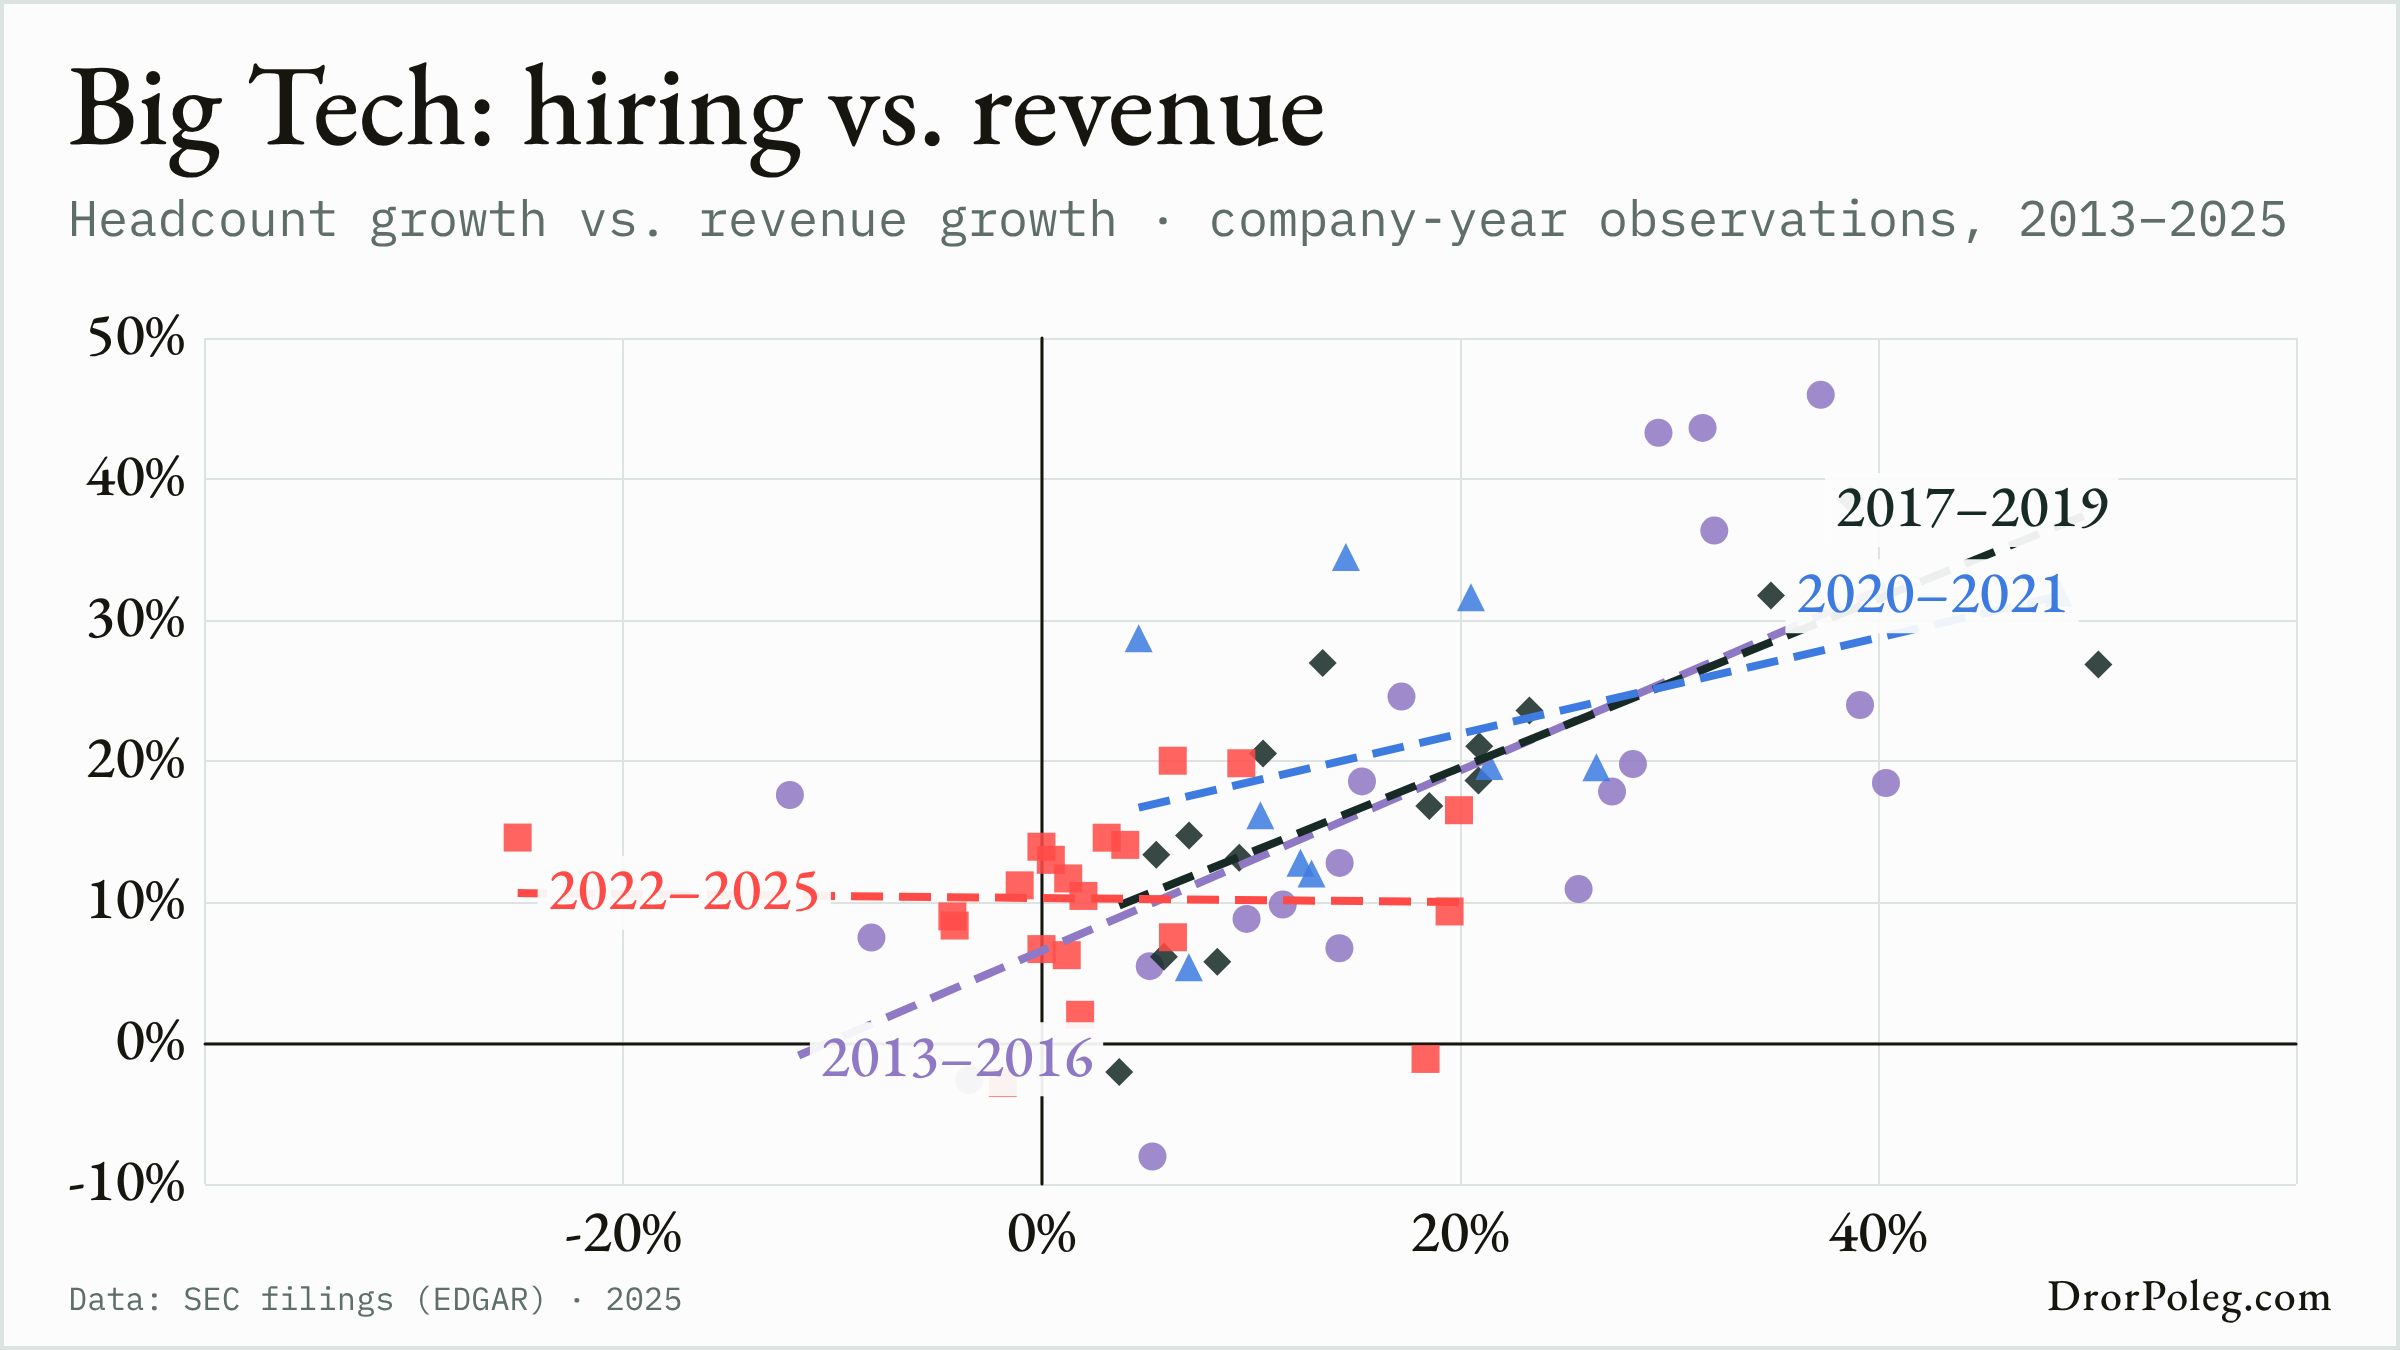
See all 100 Work and Productivity charts →
A living research library of 256 charts, drawing from 42 databases and APIs, with 42 charts updated in the past seven days.
See all 100 Work and Productivity charts →
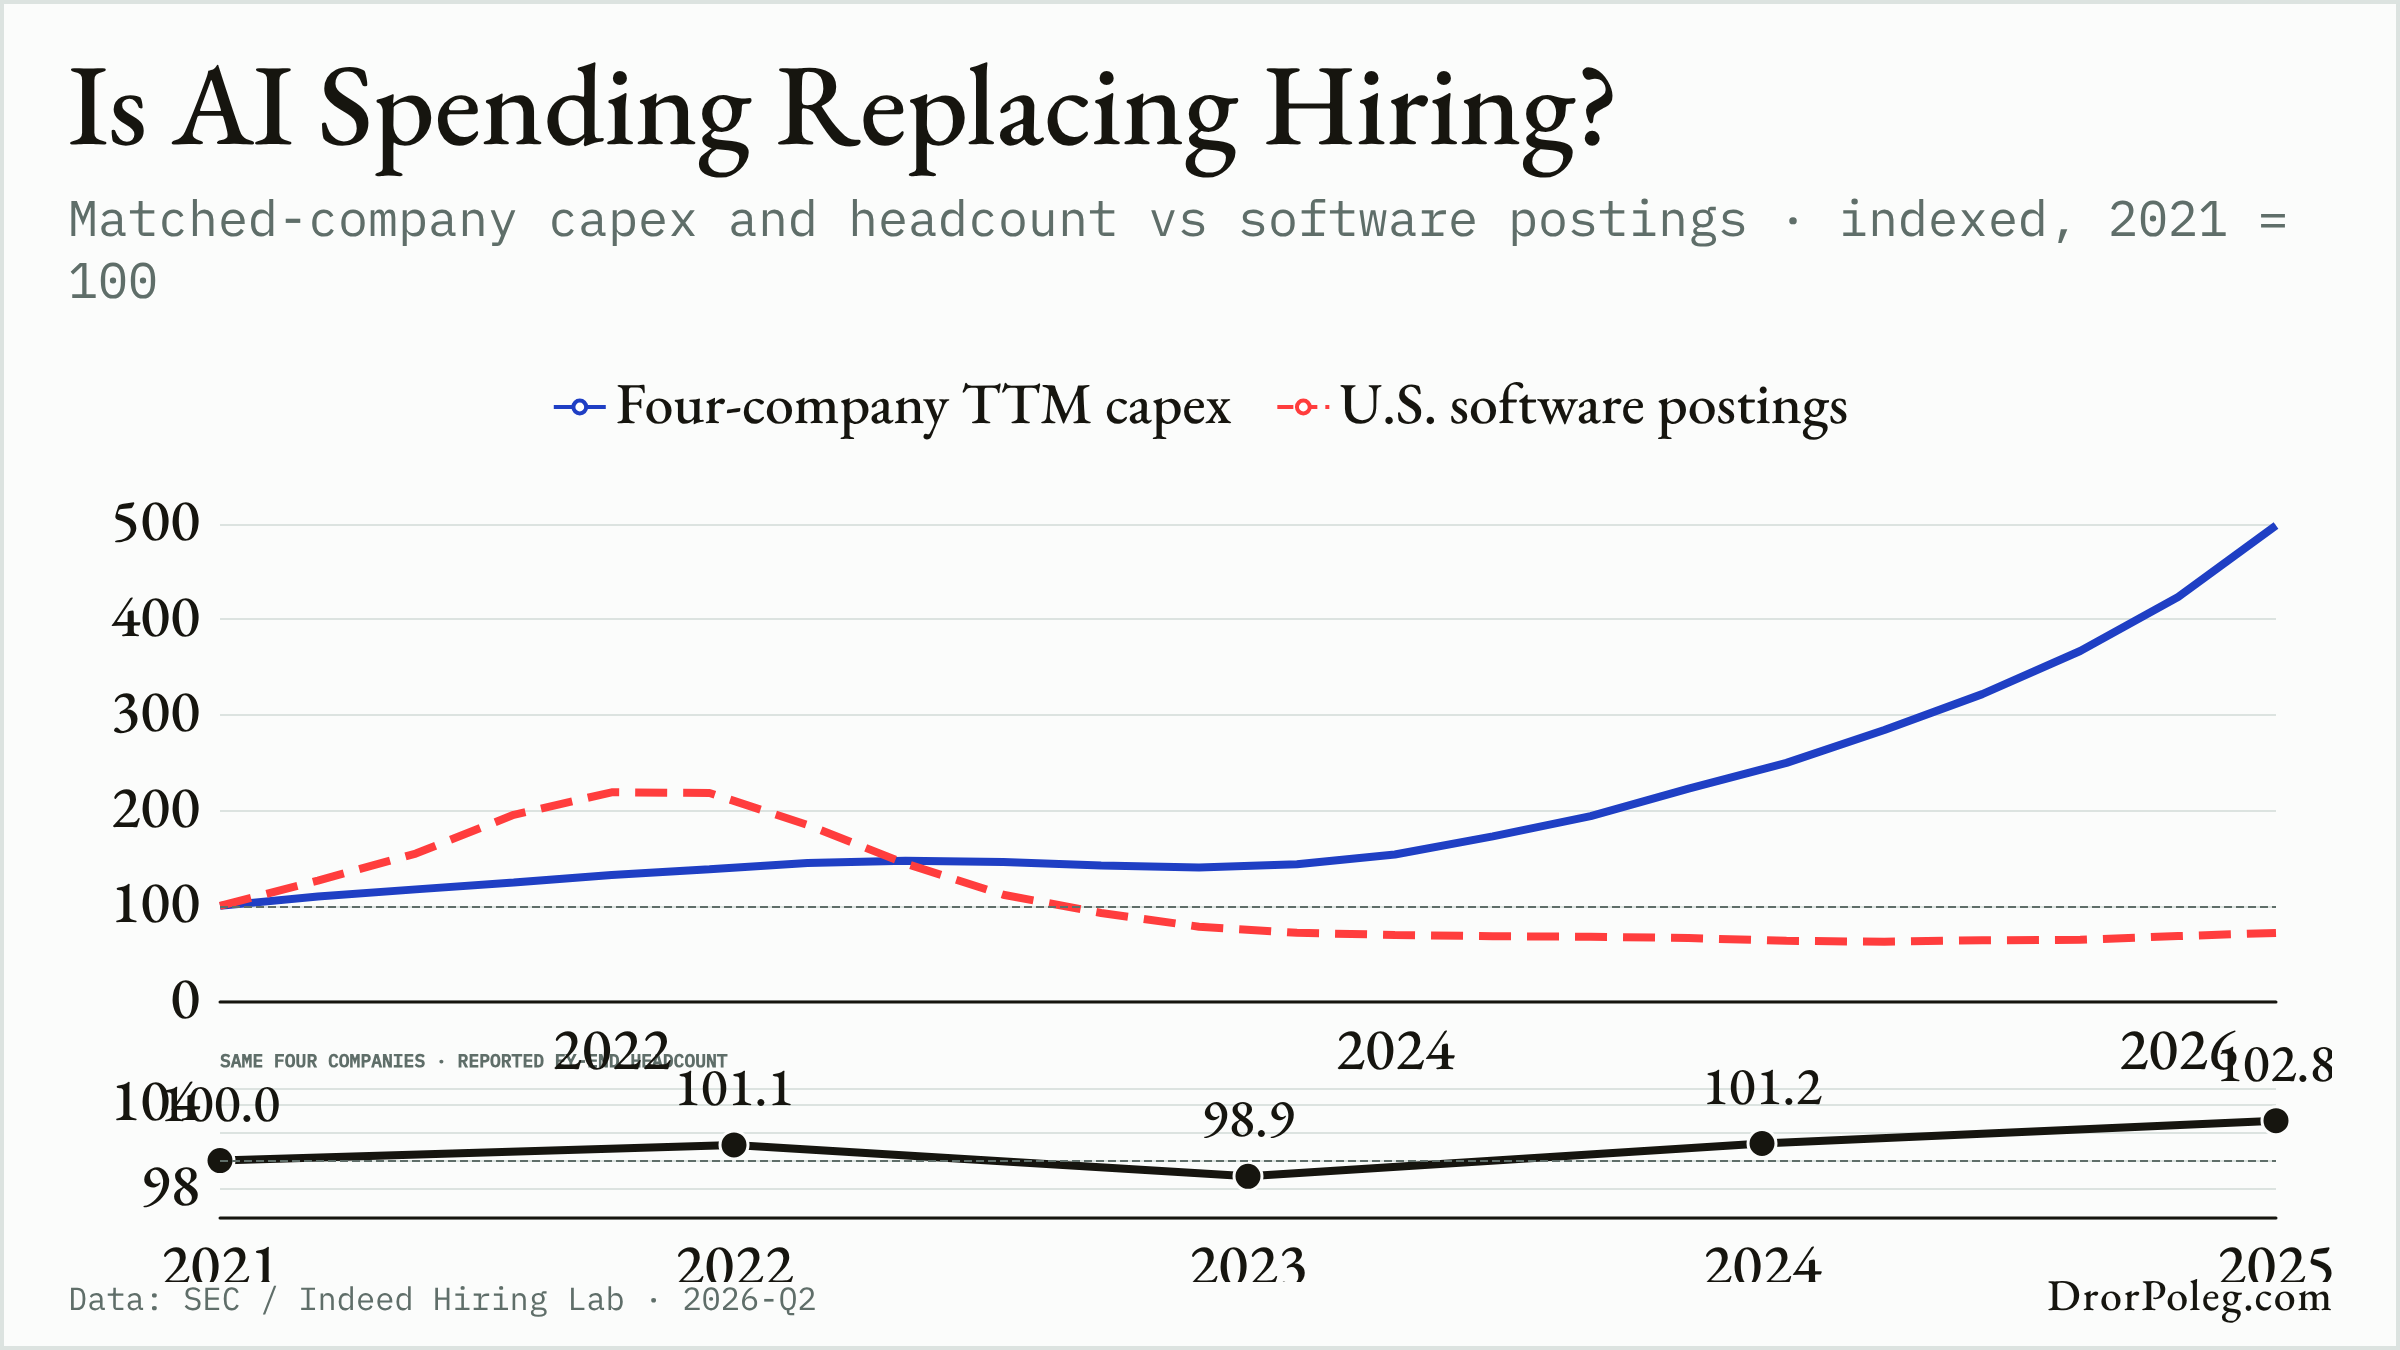
See all 71 AI and Technology charts →
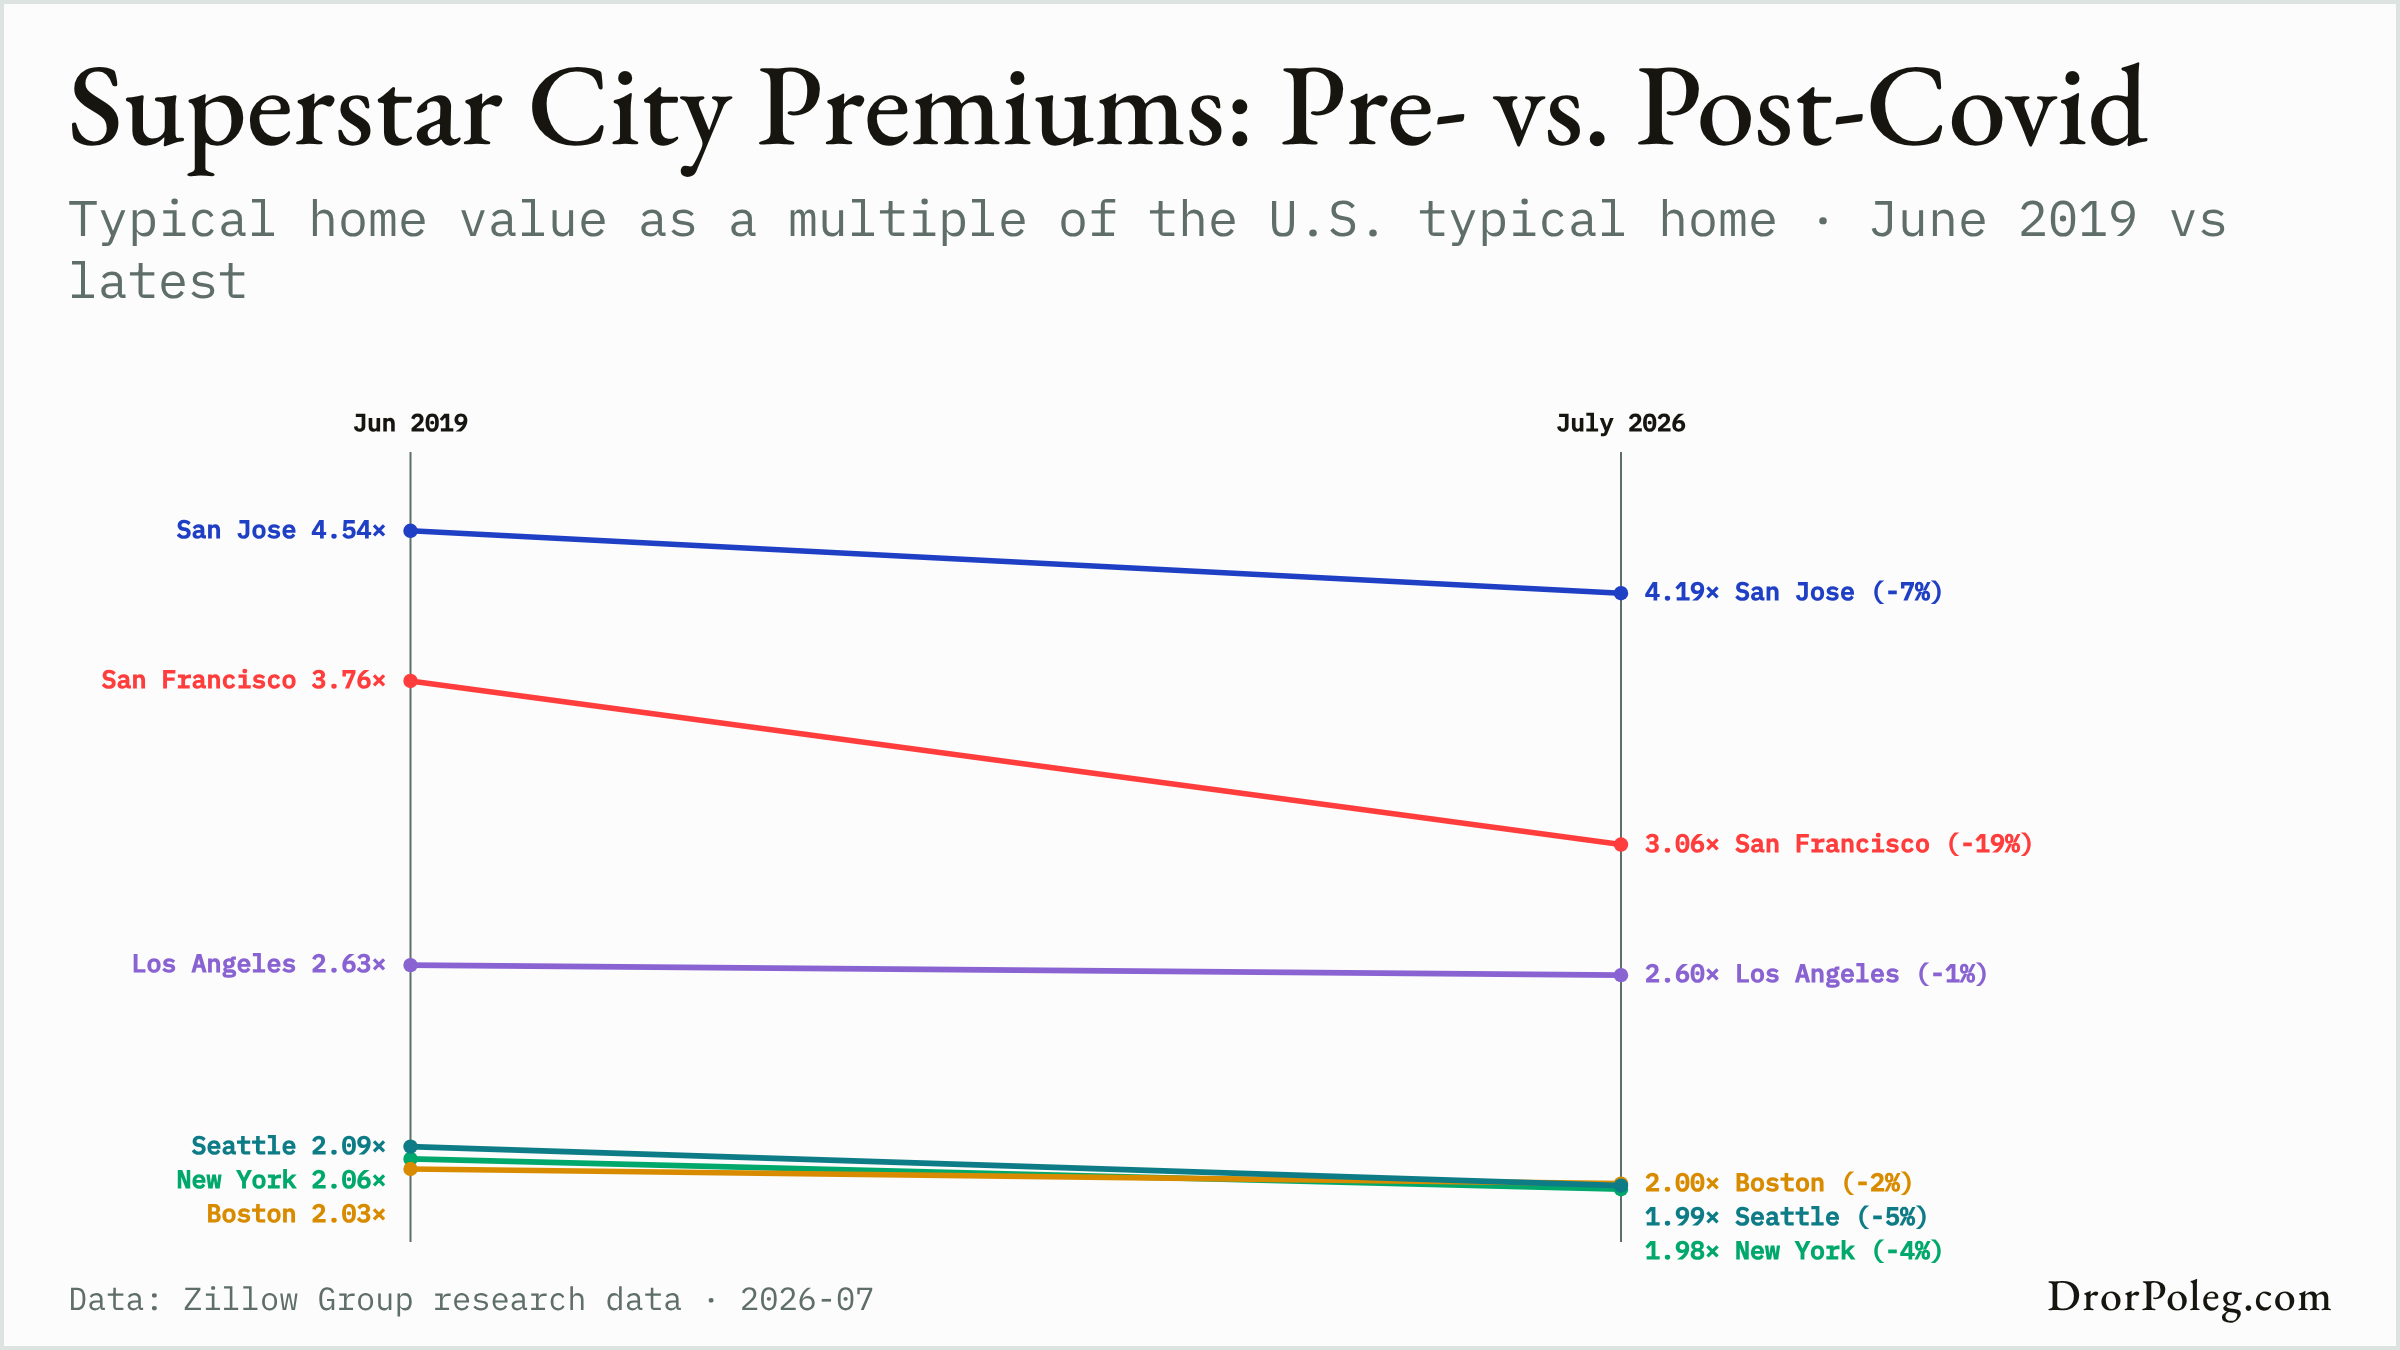
See all 29 Cities and Real Estate charts →
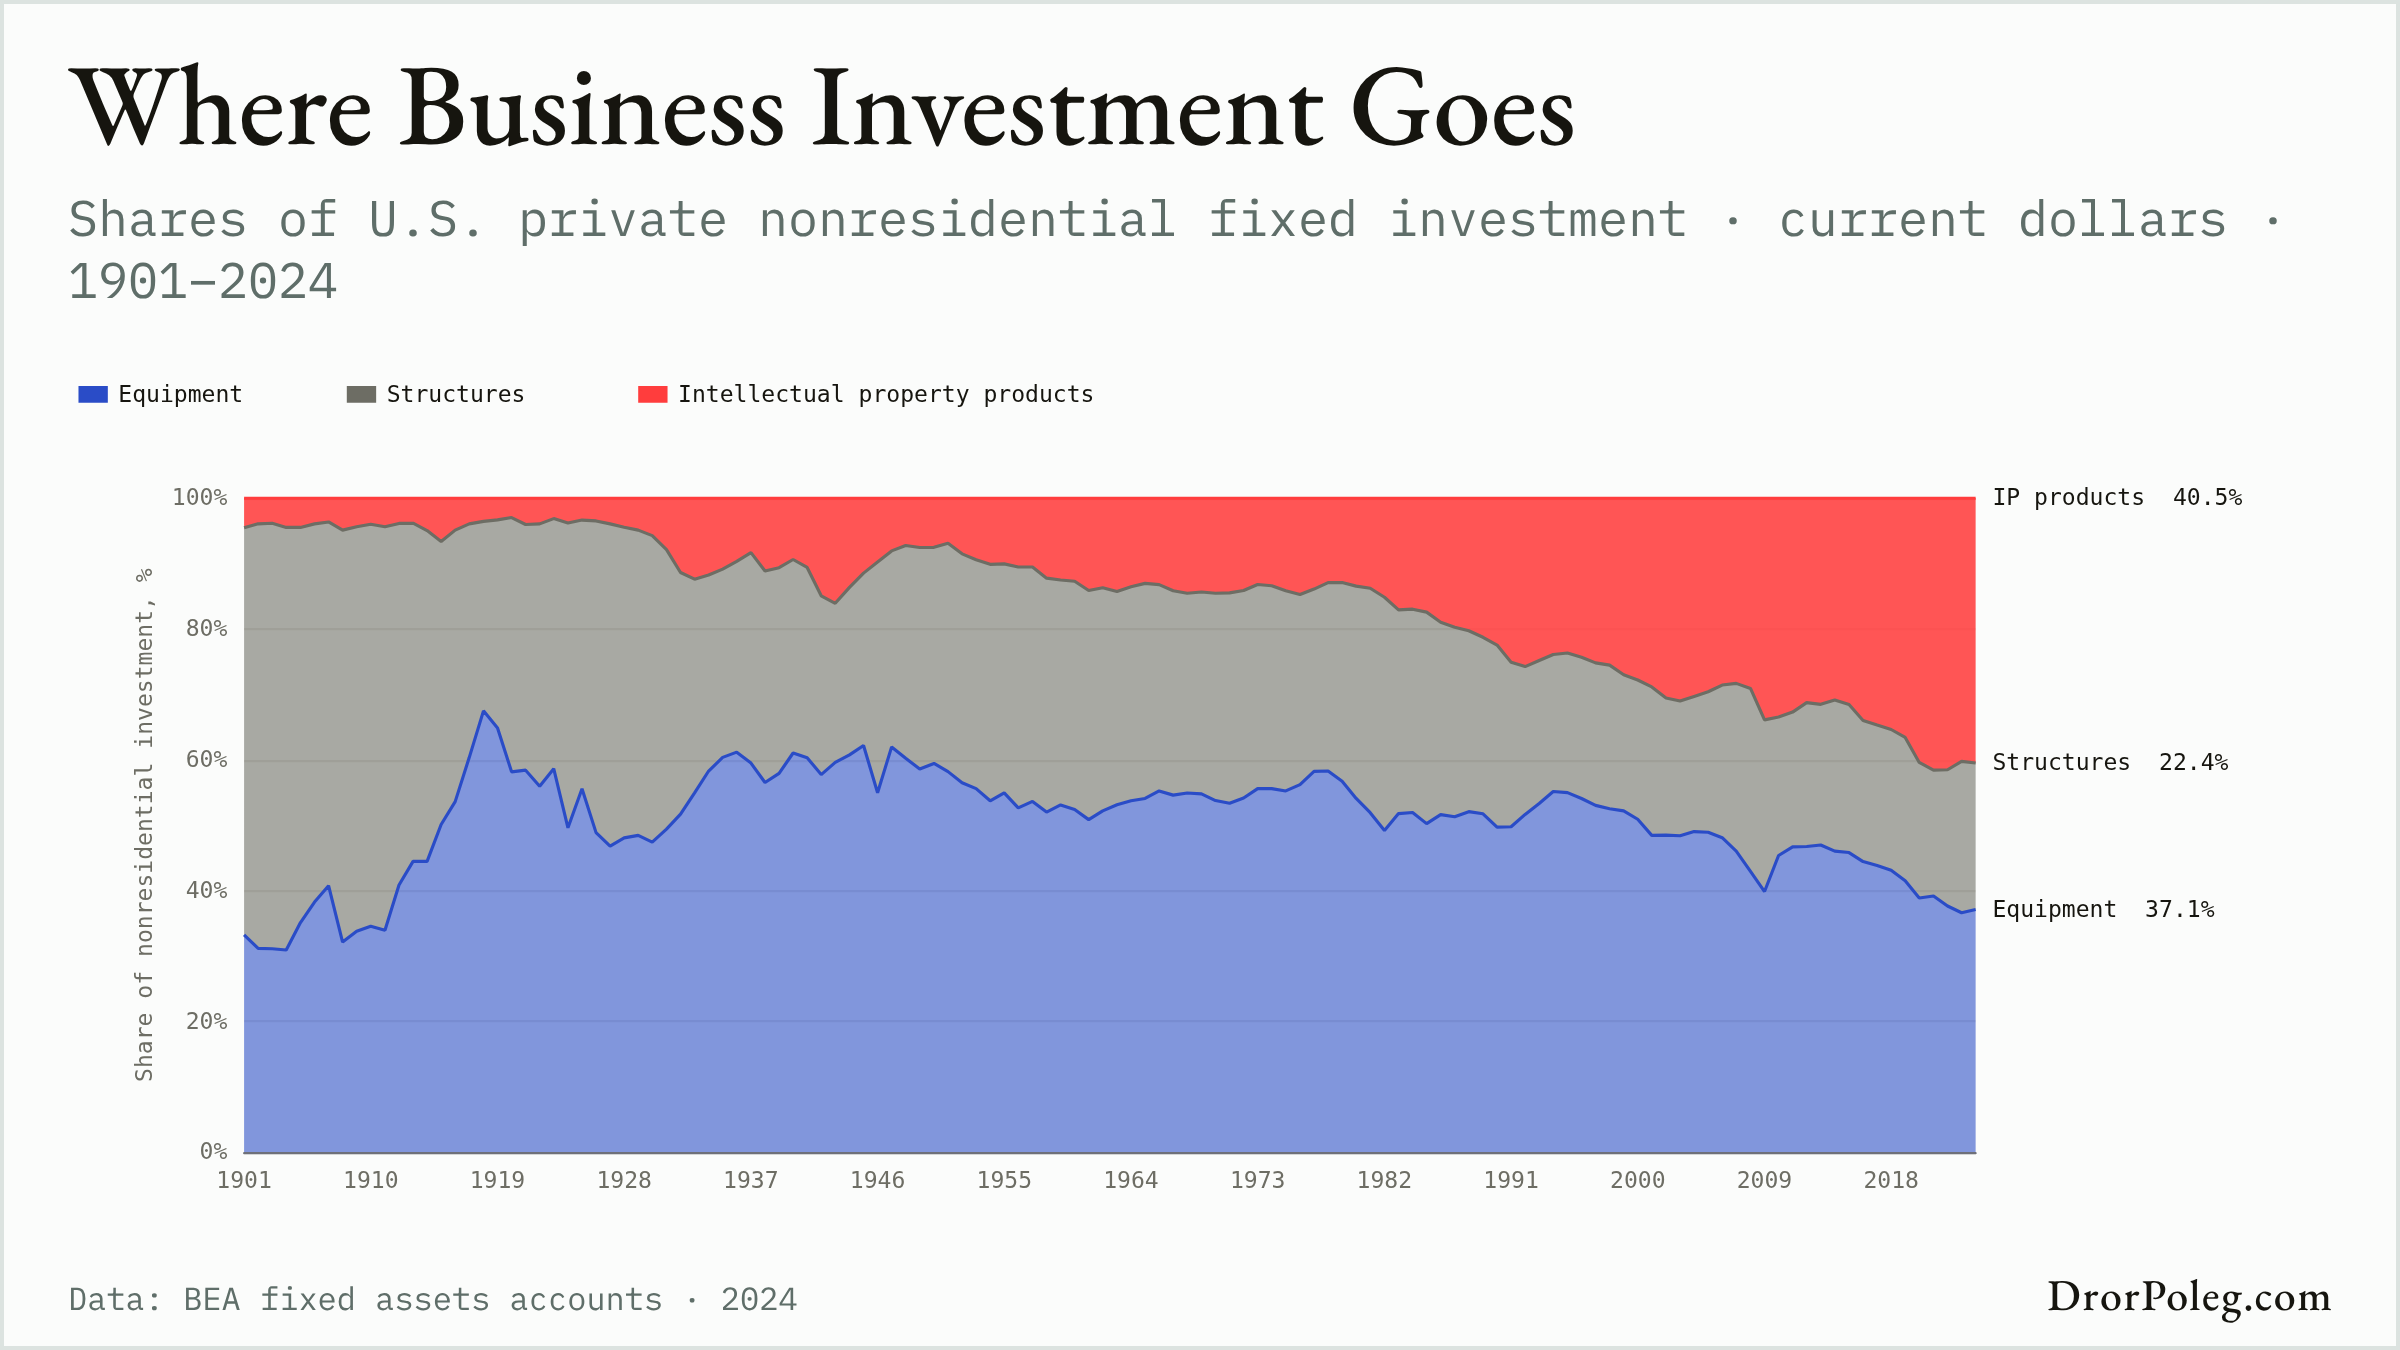
See all 130 Economy and Markets charts →
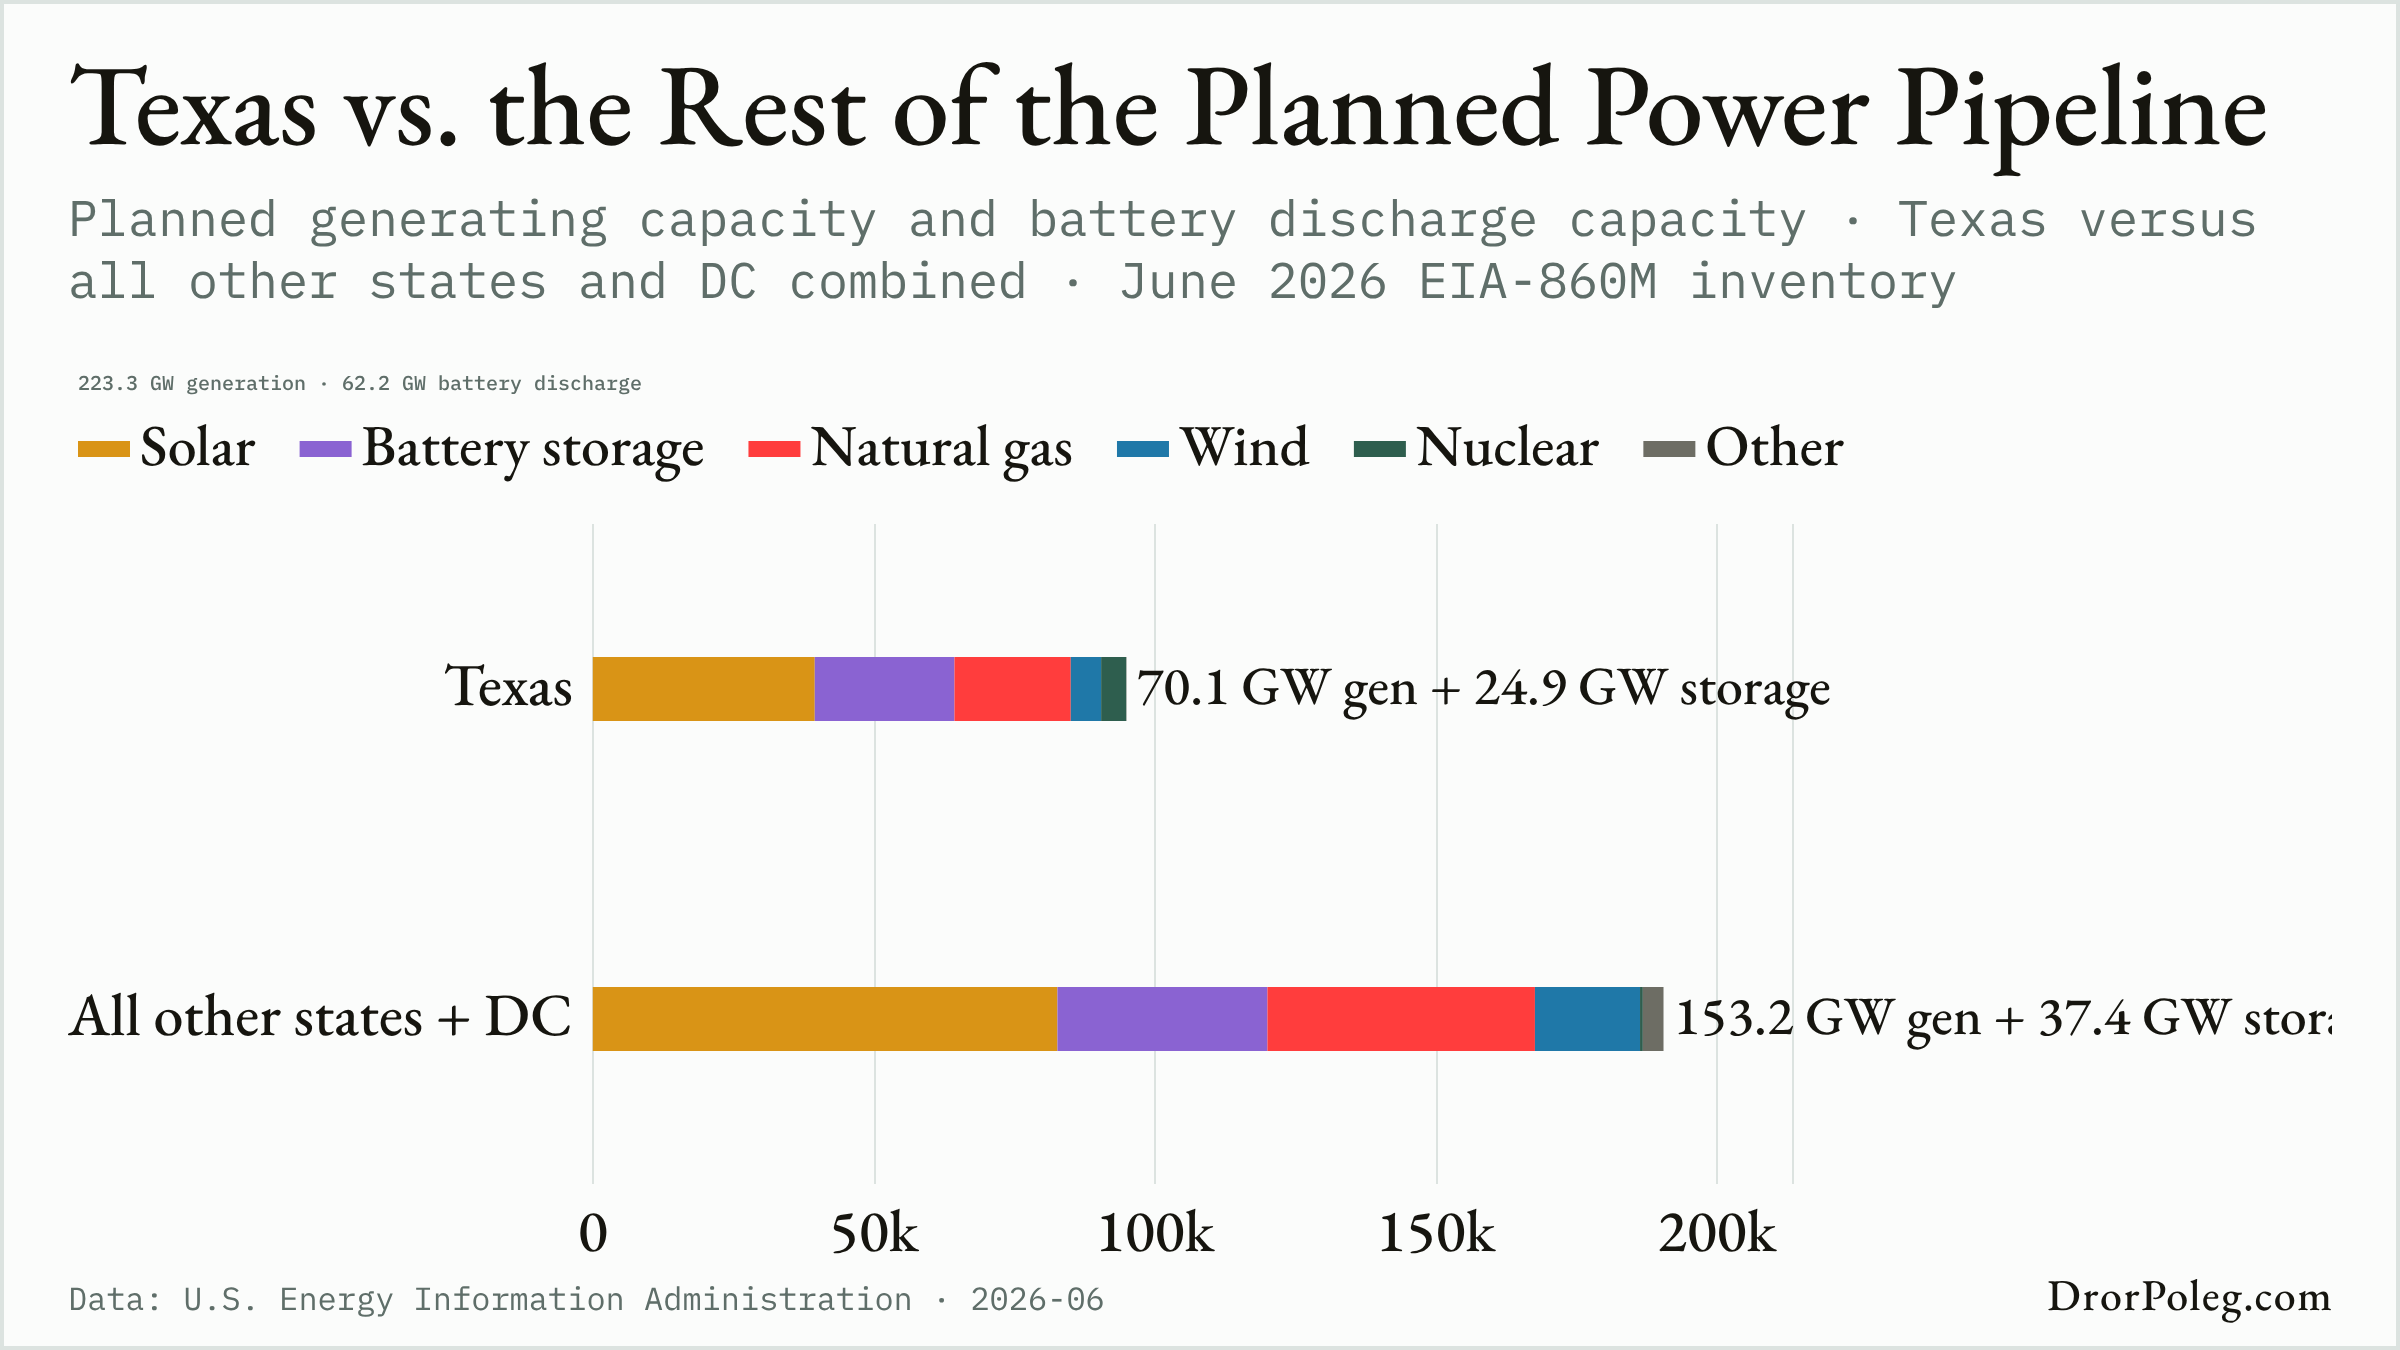
See all 27 Energy and Infrastructure charts →
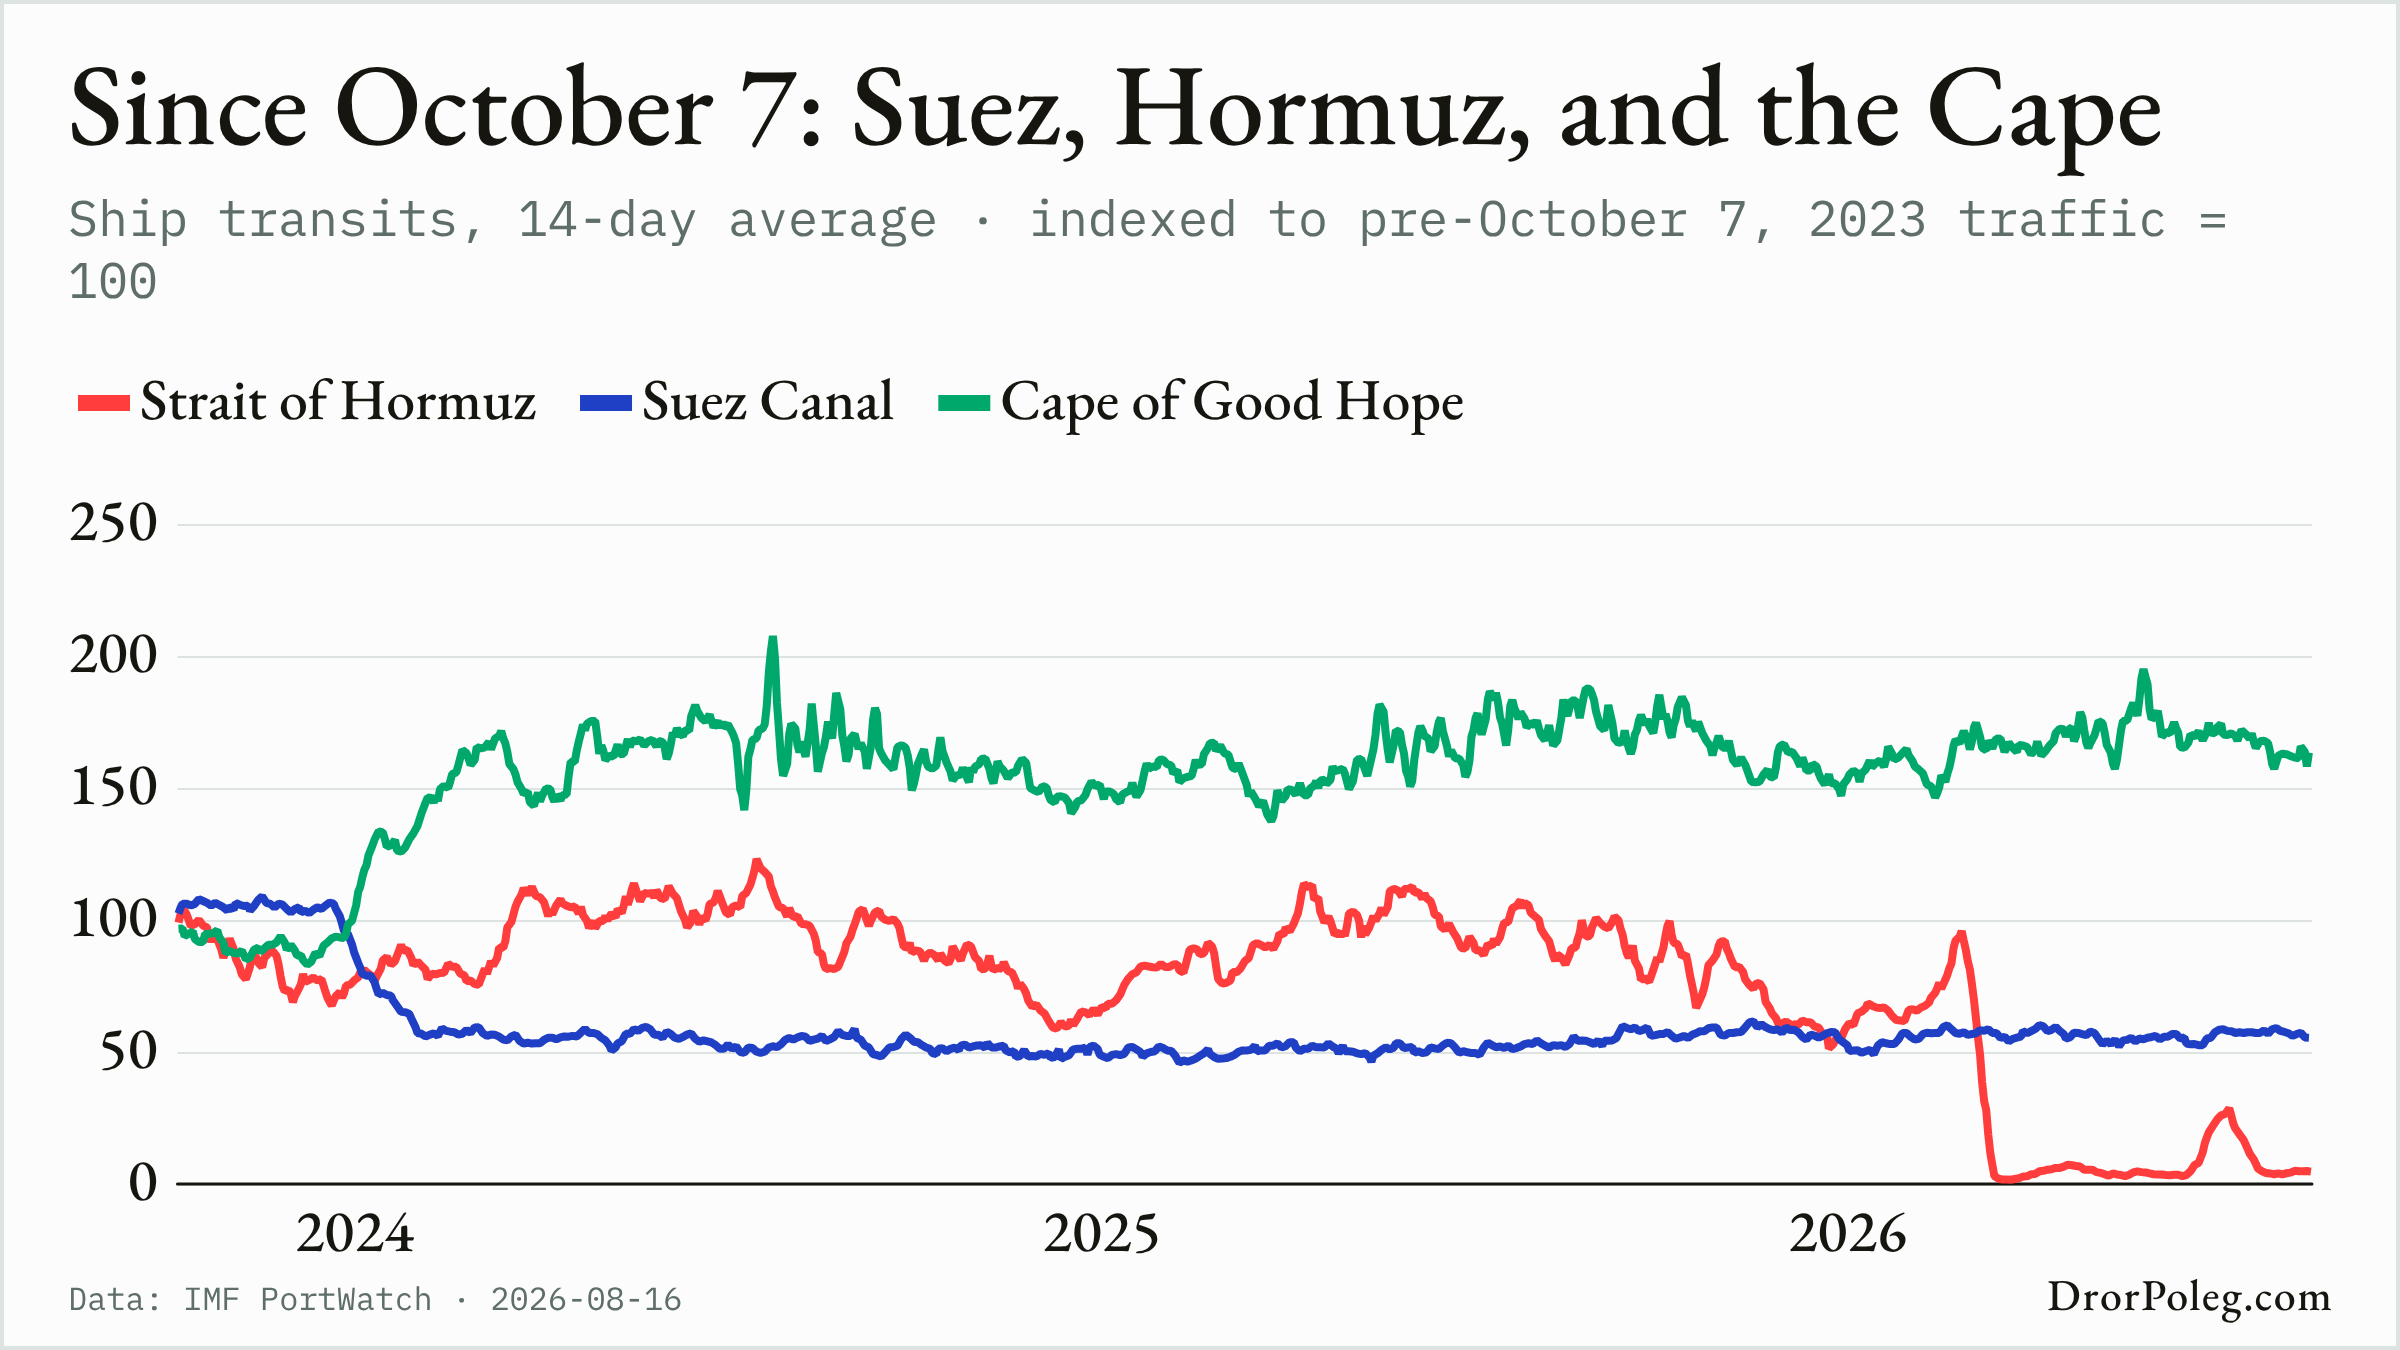
See all 46 Geopolitics and Society charts →
Average daily pageviews over the latest 3 days vs. the previous 365-day average
Energy and InfrastructureWeekly average reported reactor power across active units, % · trailing 365 days
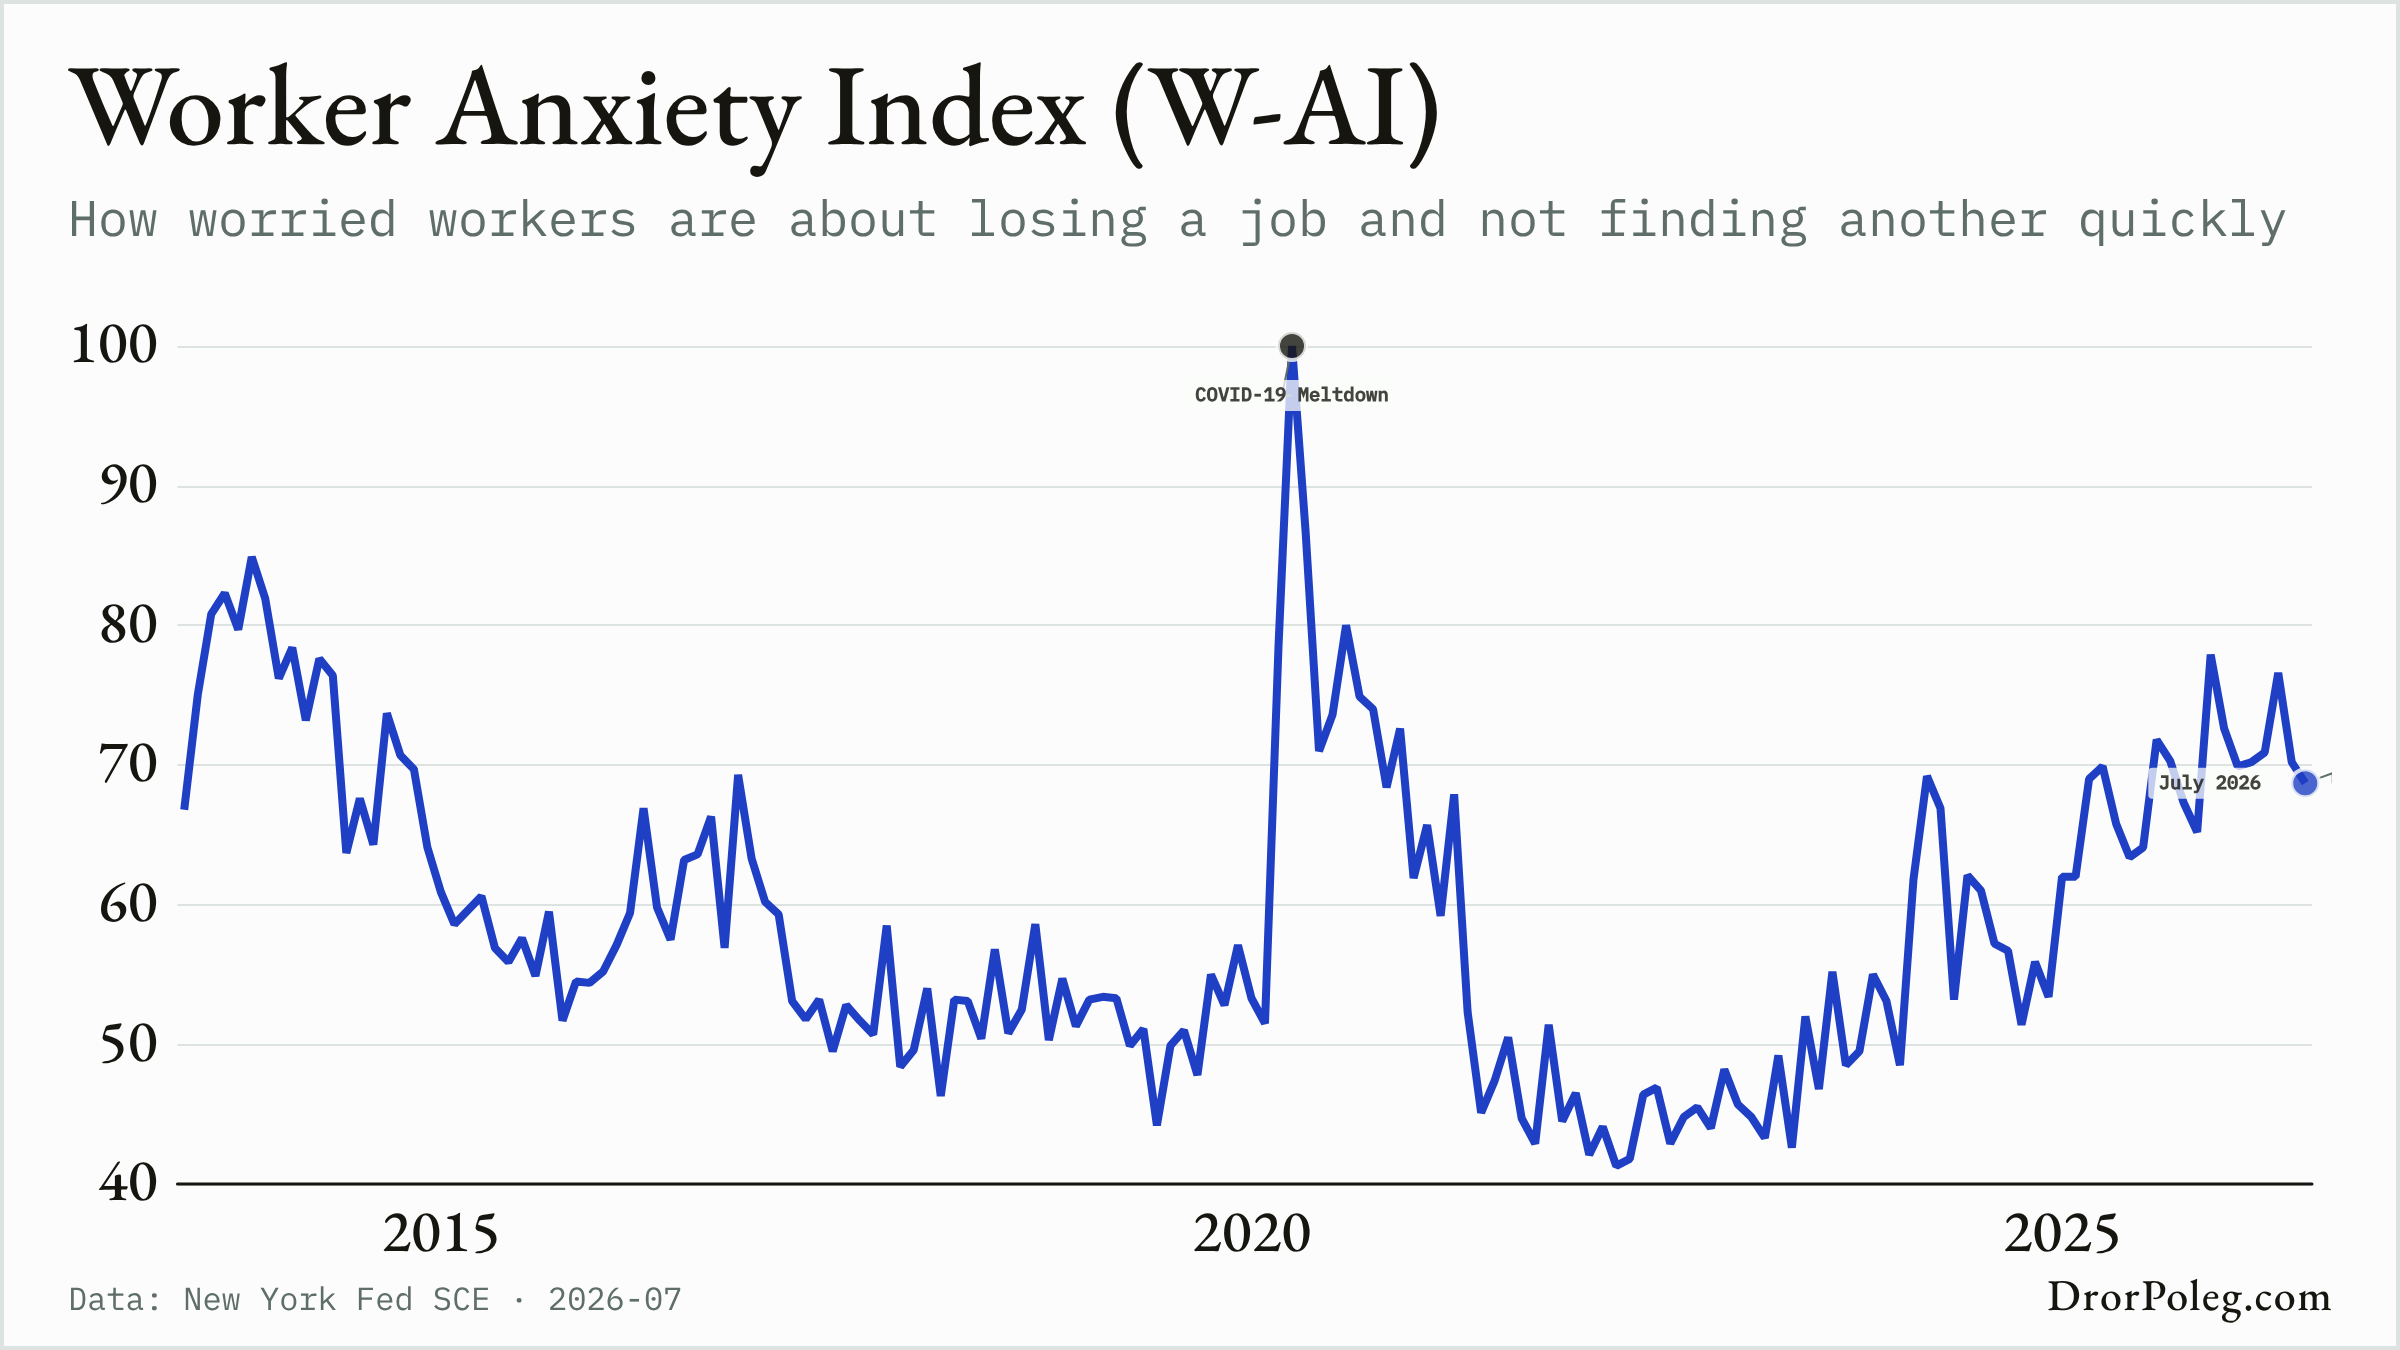
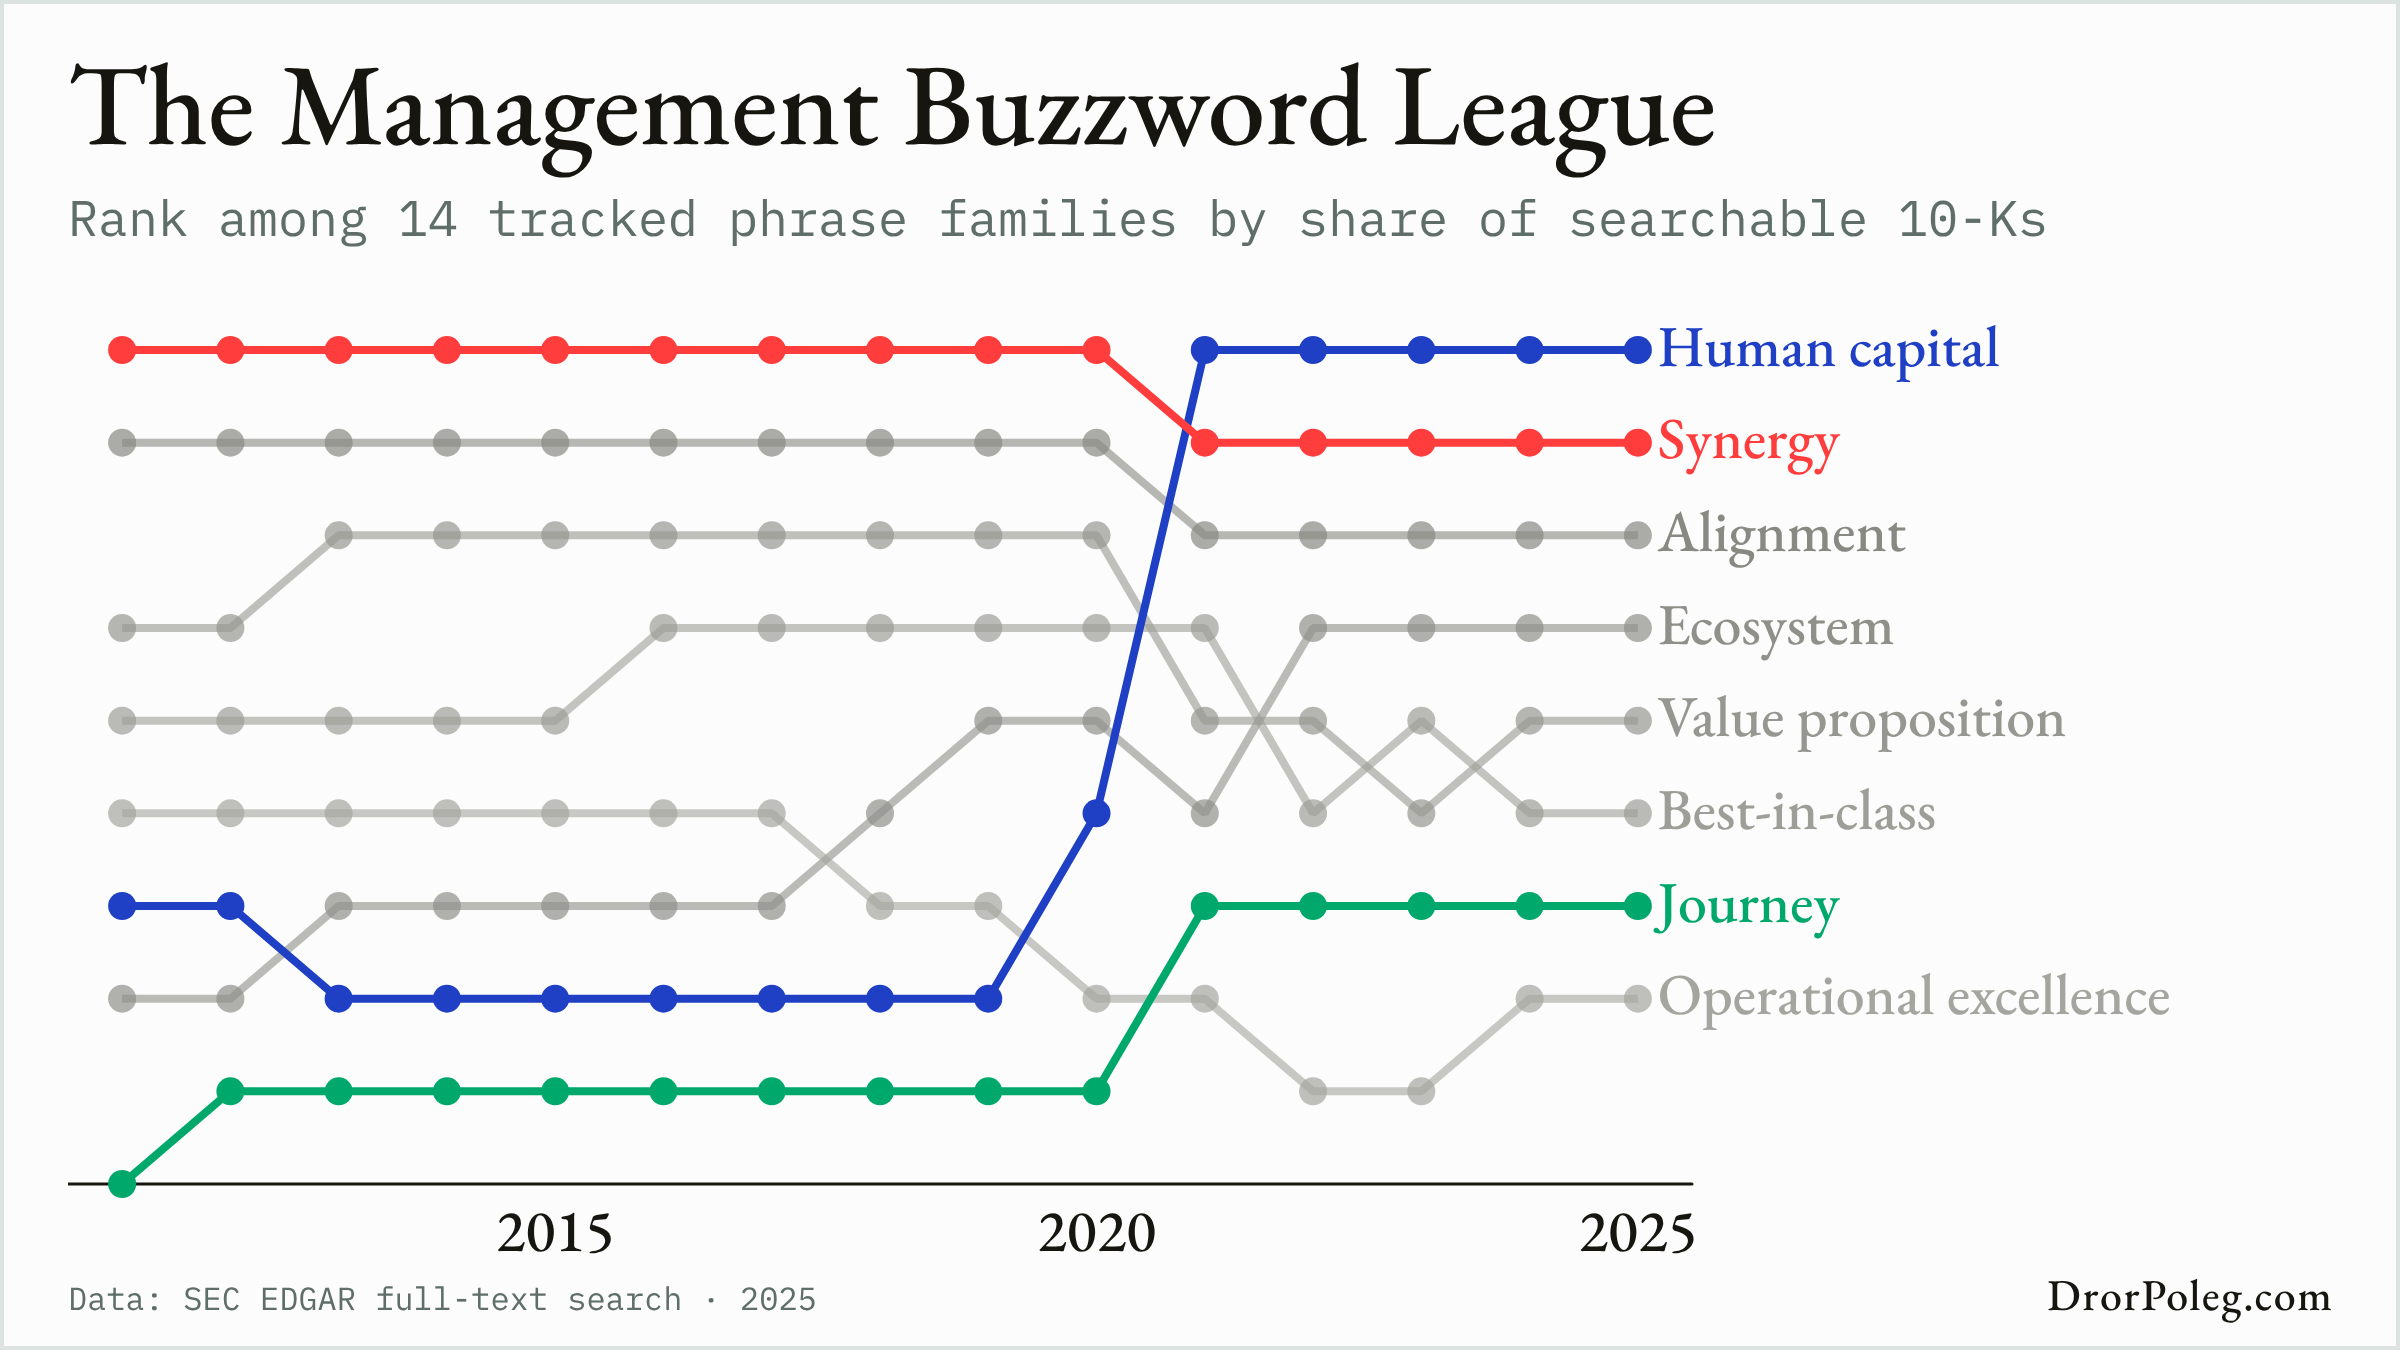
Work and ProductivityWikipedia attention composite and BLS layoffs rate, standardized; 3-month averages
Economy and MarketsTrailing-4-quarter average share captured by the top 10 SEC-frame entities, %
Economy and MarketsDaily par yields, %
Economy and MarketsRegistry events, trailing 12 months, thousands
Economy and Markets% real yield, monthly average of daily closes
AI and TechnologyCVE records per month, 20 organizations
AI and TechnologyPercent of CVE records published that month
AI and TechnologyCVE records, by publication month
Work and ProductivityE-commerce share of retail sales and employment · independently indexed to 2019 = 100
Geopolitics and SocietyShip transits, 14-day average · indexed to pre-October 7, 2023 traffic = 100
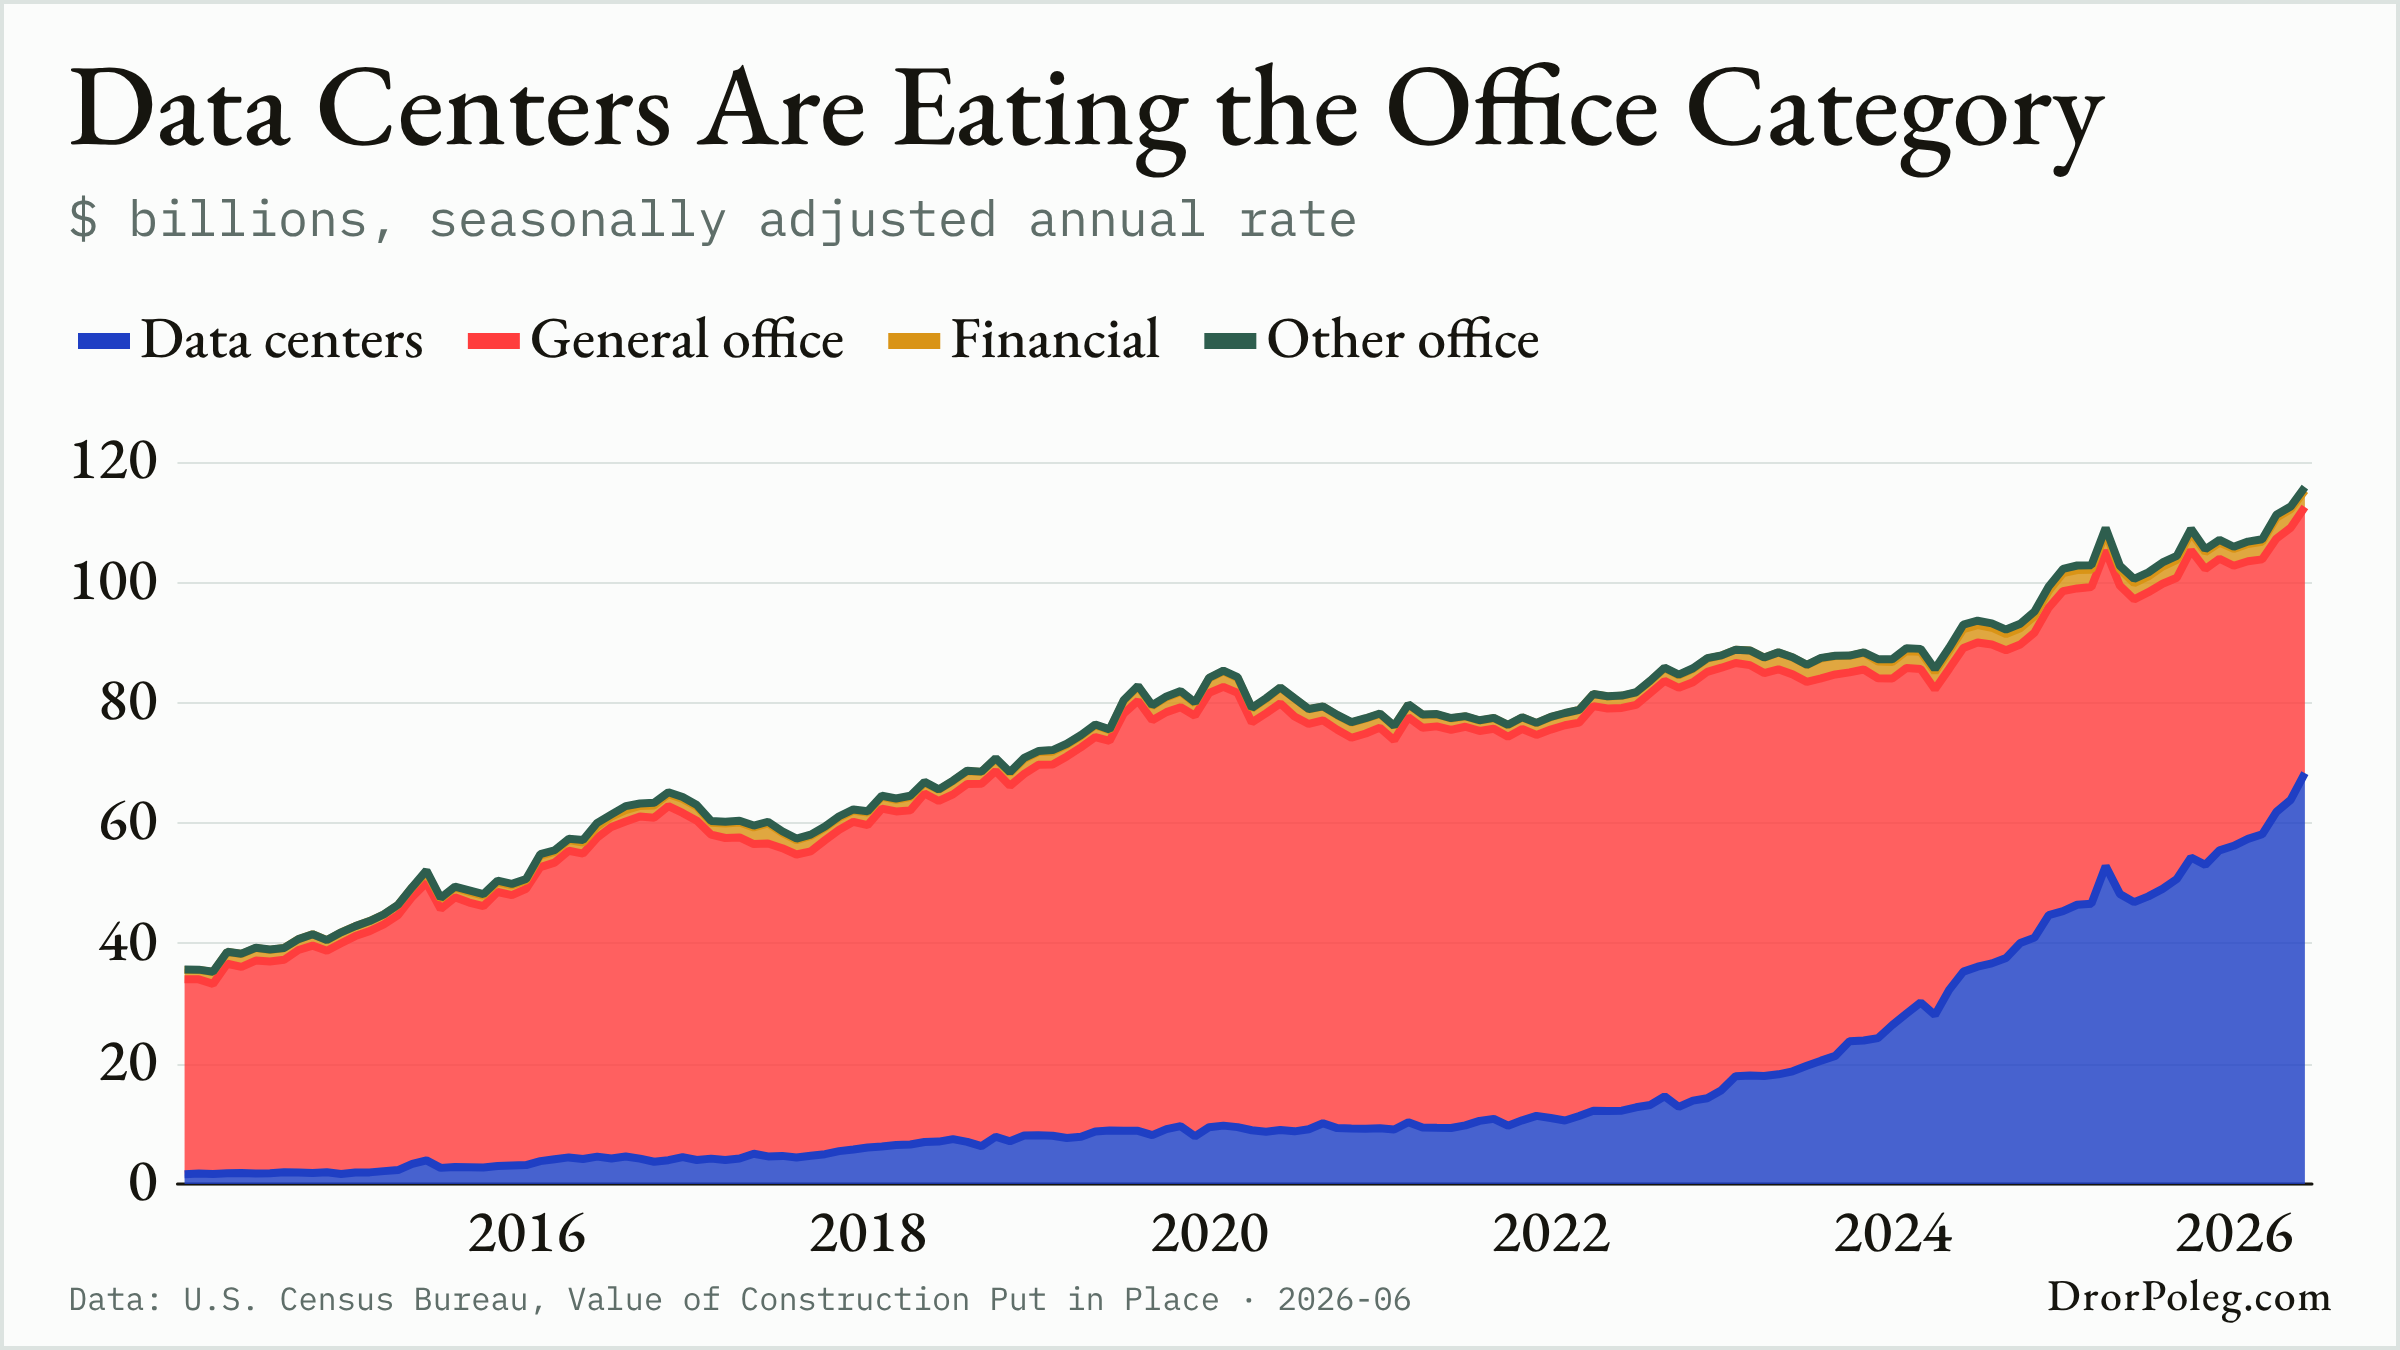
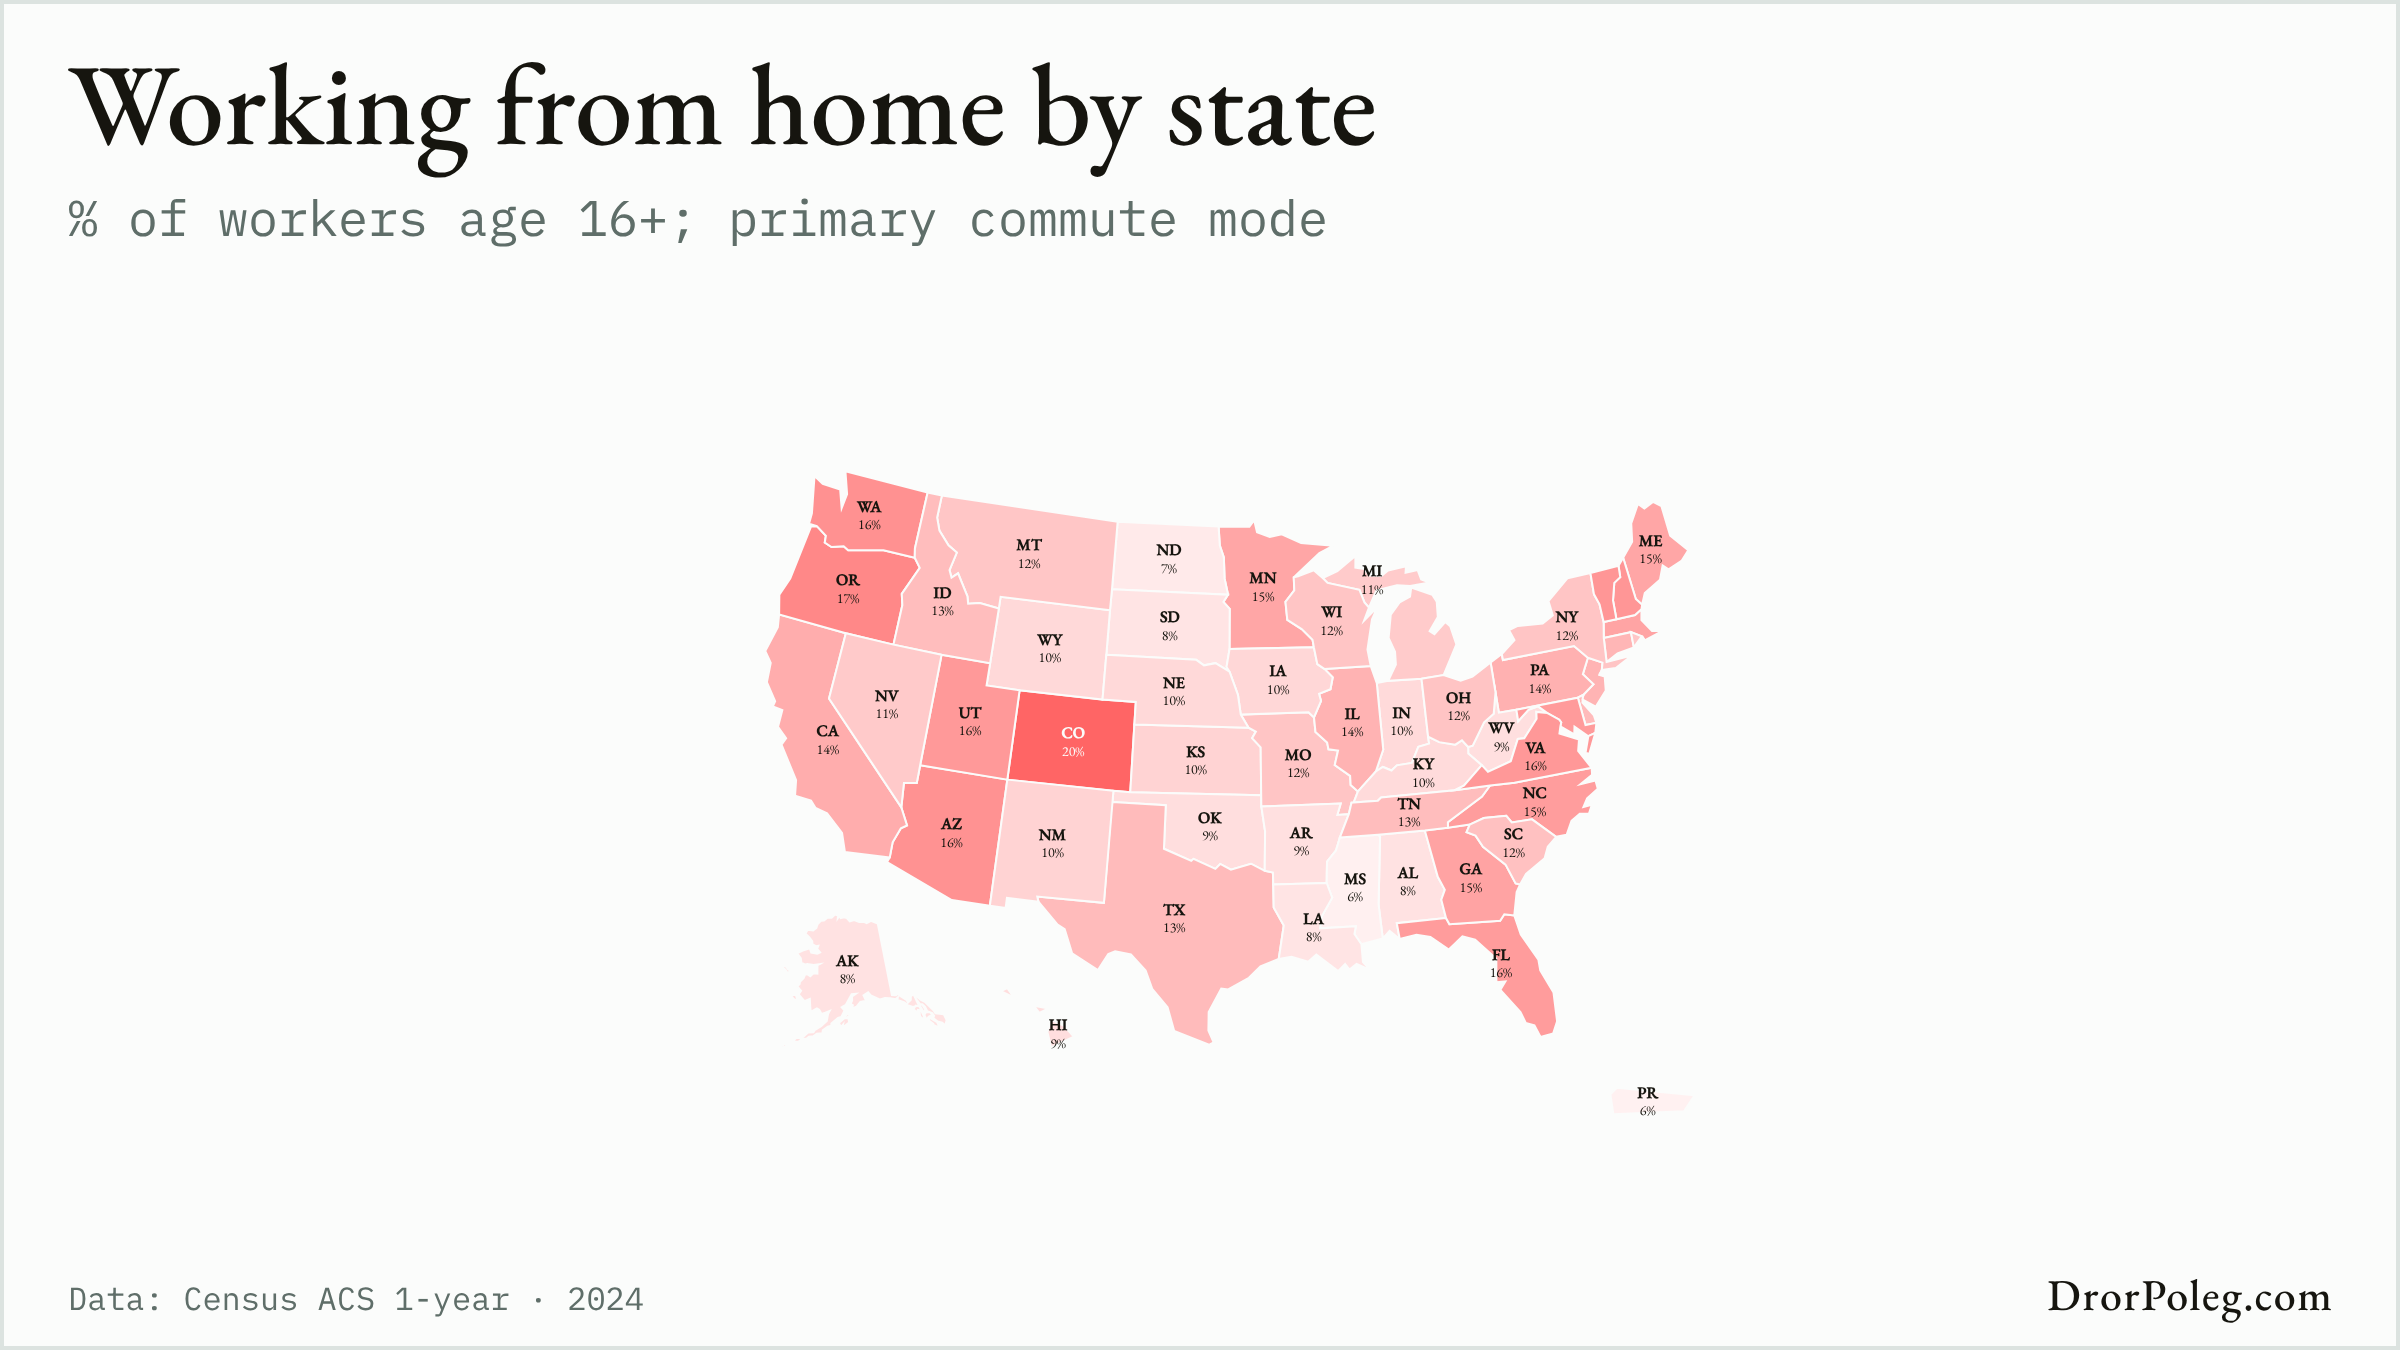
Interactive feature · Pinned
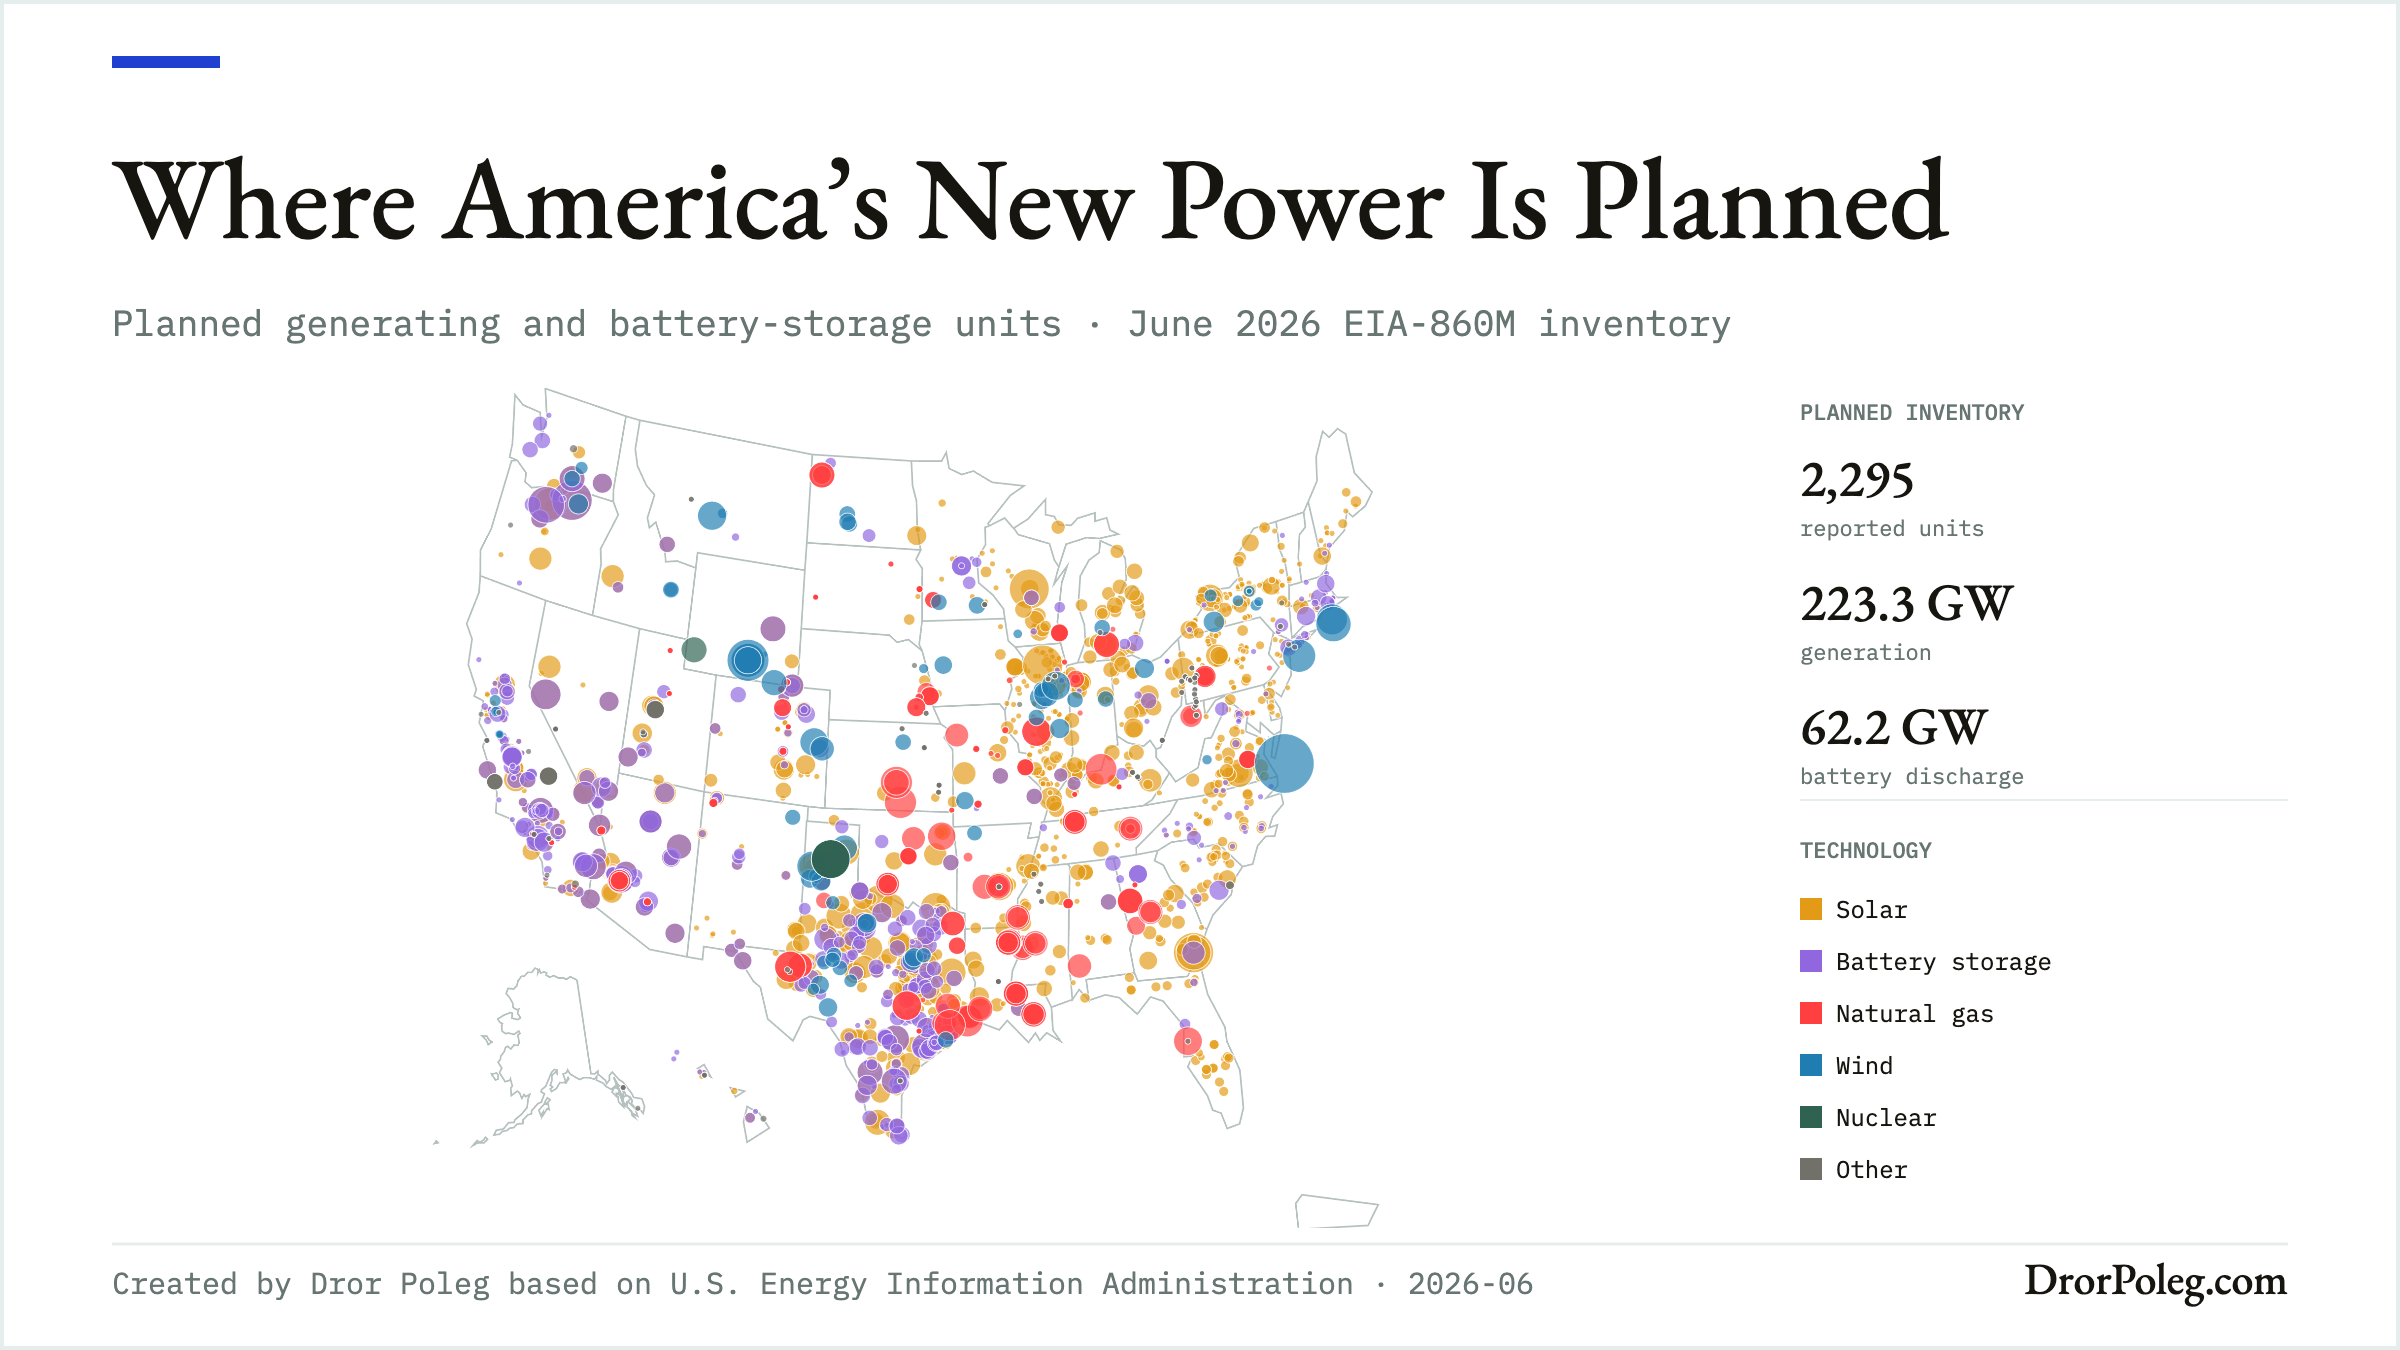
Explore planned generating and storage projects by technology, development stage, capacity, and location.
Explore the live map →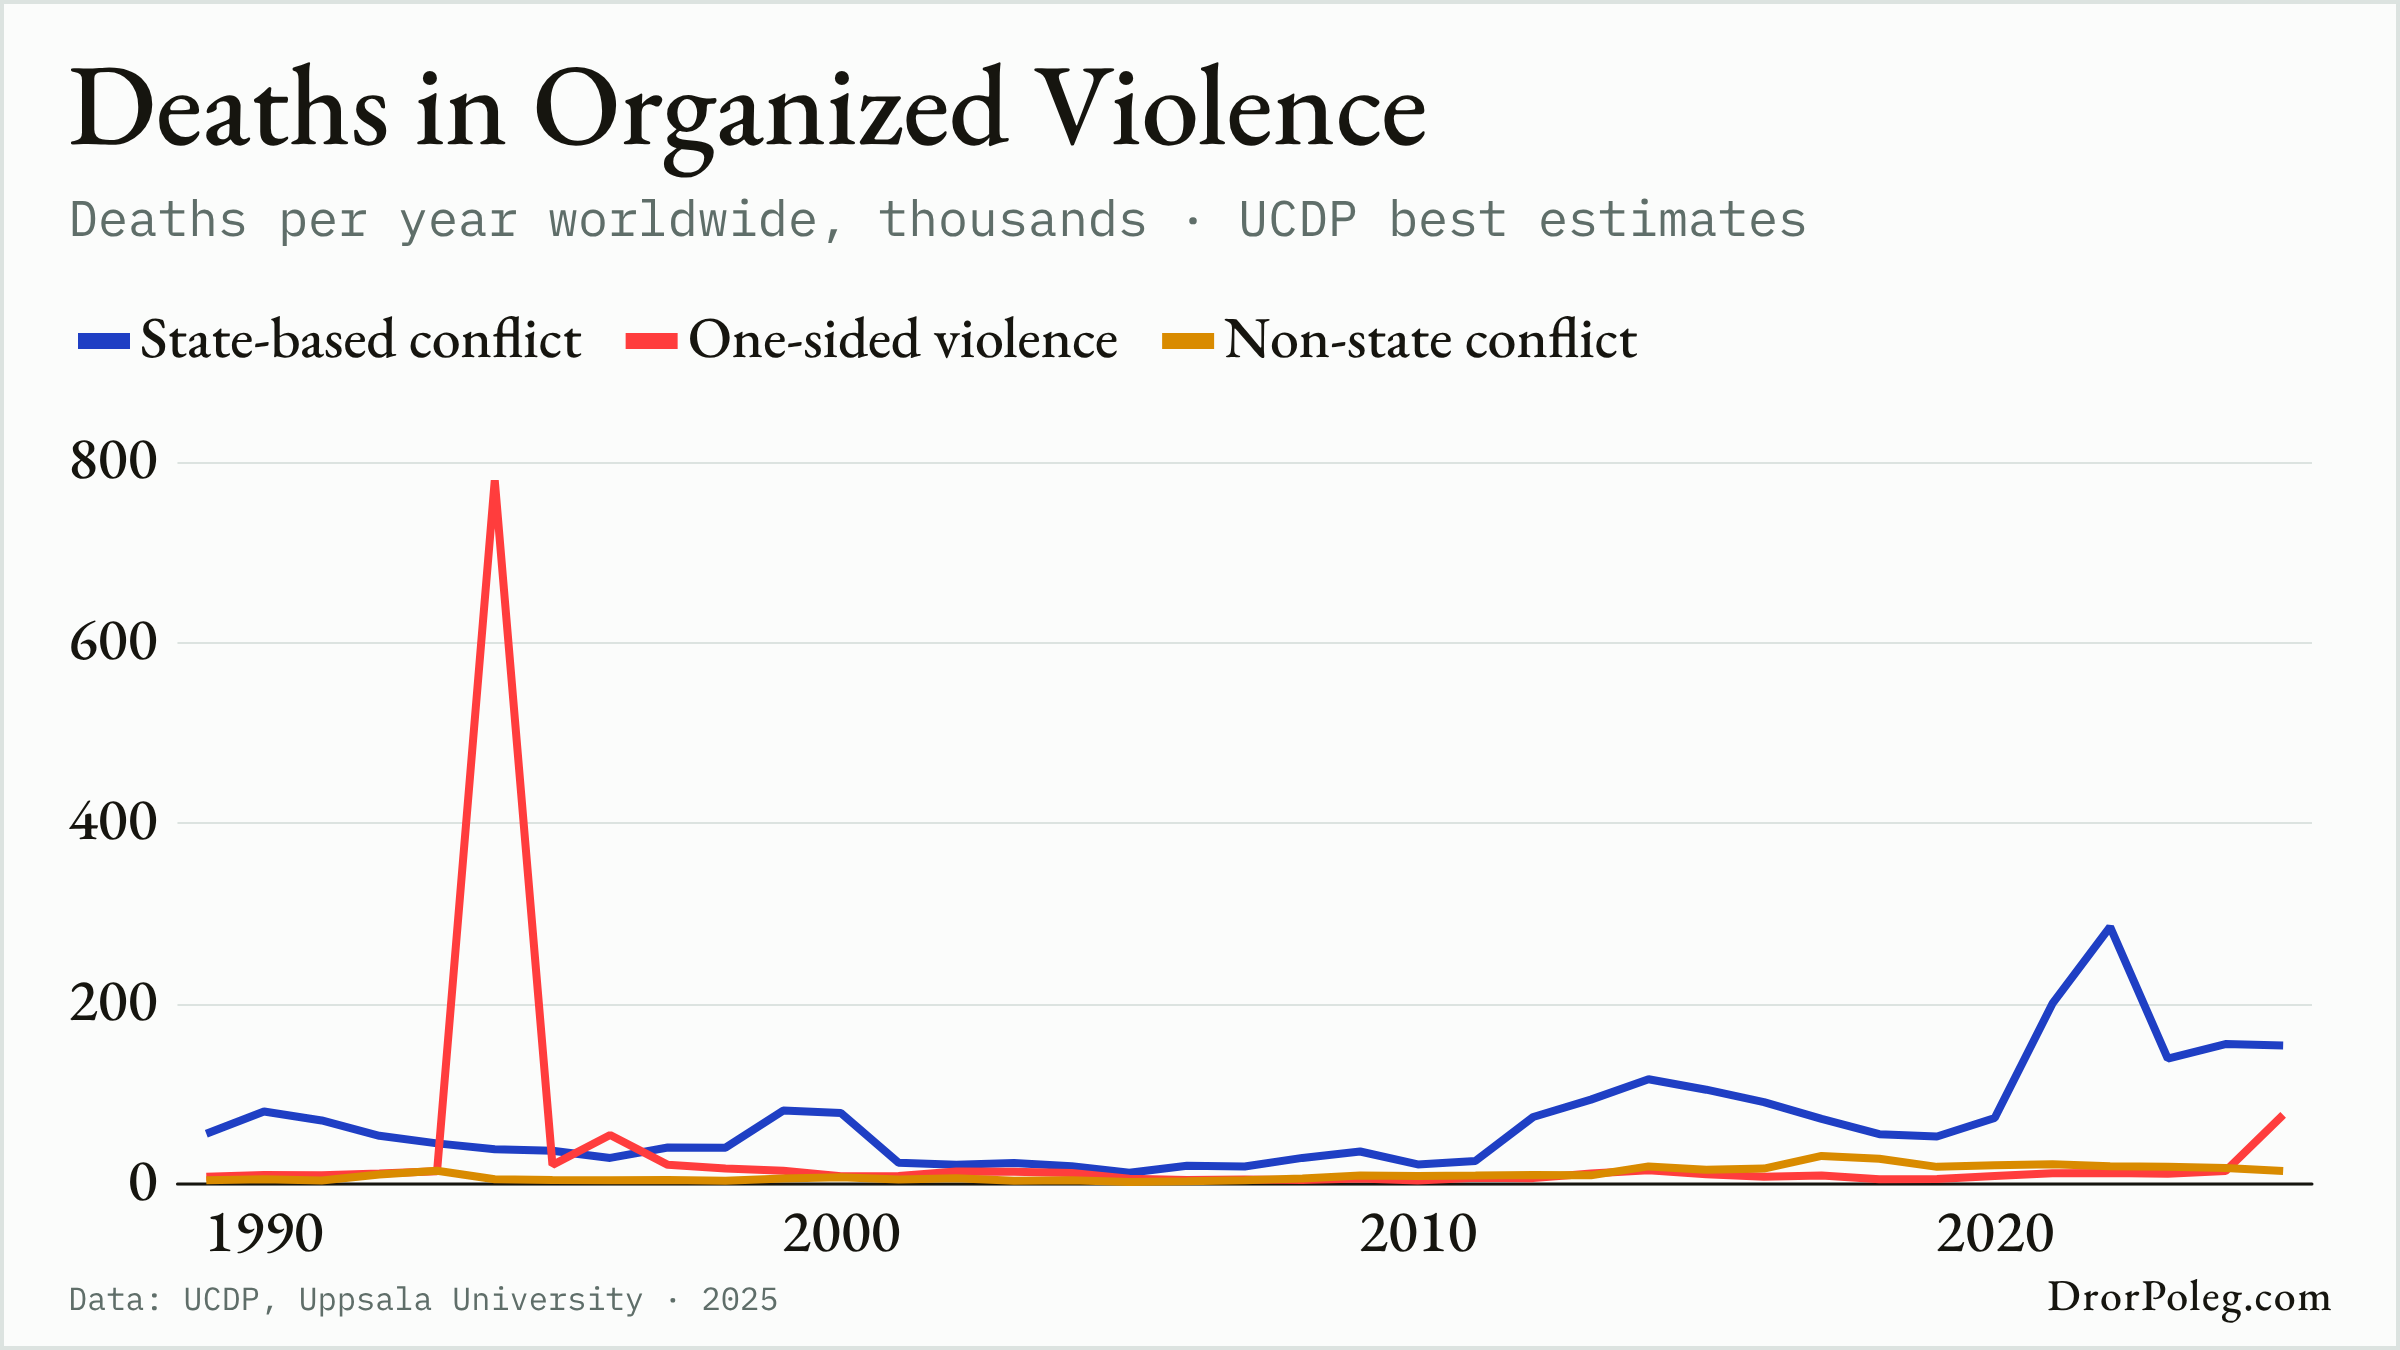
Deep dive · Most recent
How the wars of the 2020s left the battlefield: seven charts tracing conflict deaths, record displacement, the collapse of the Suez and Hormuz shipping lanes, repriced insurance and food, and the defense budgets rising to answer them.
Read the 7-chart story →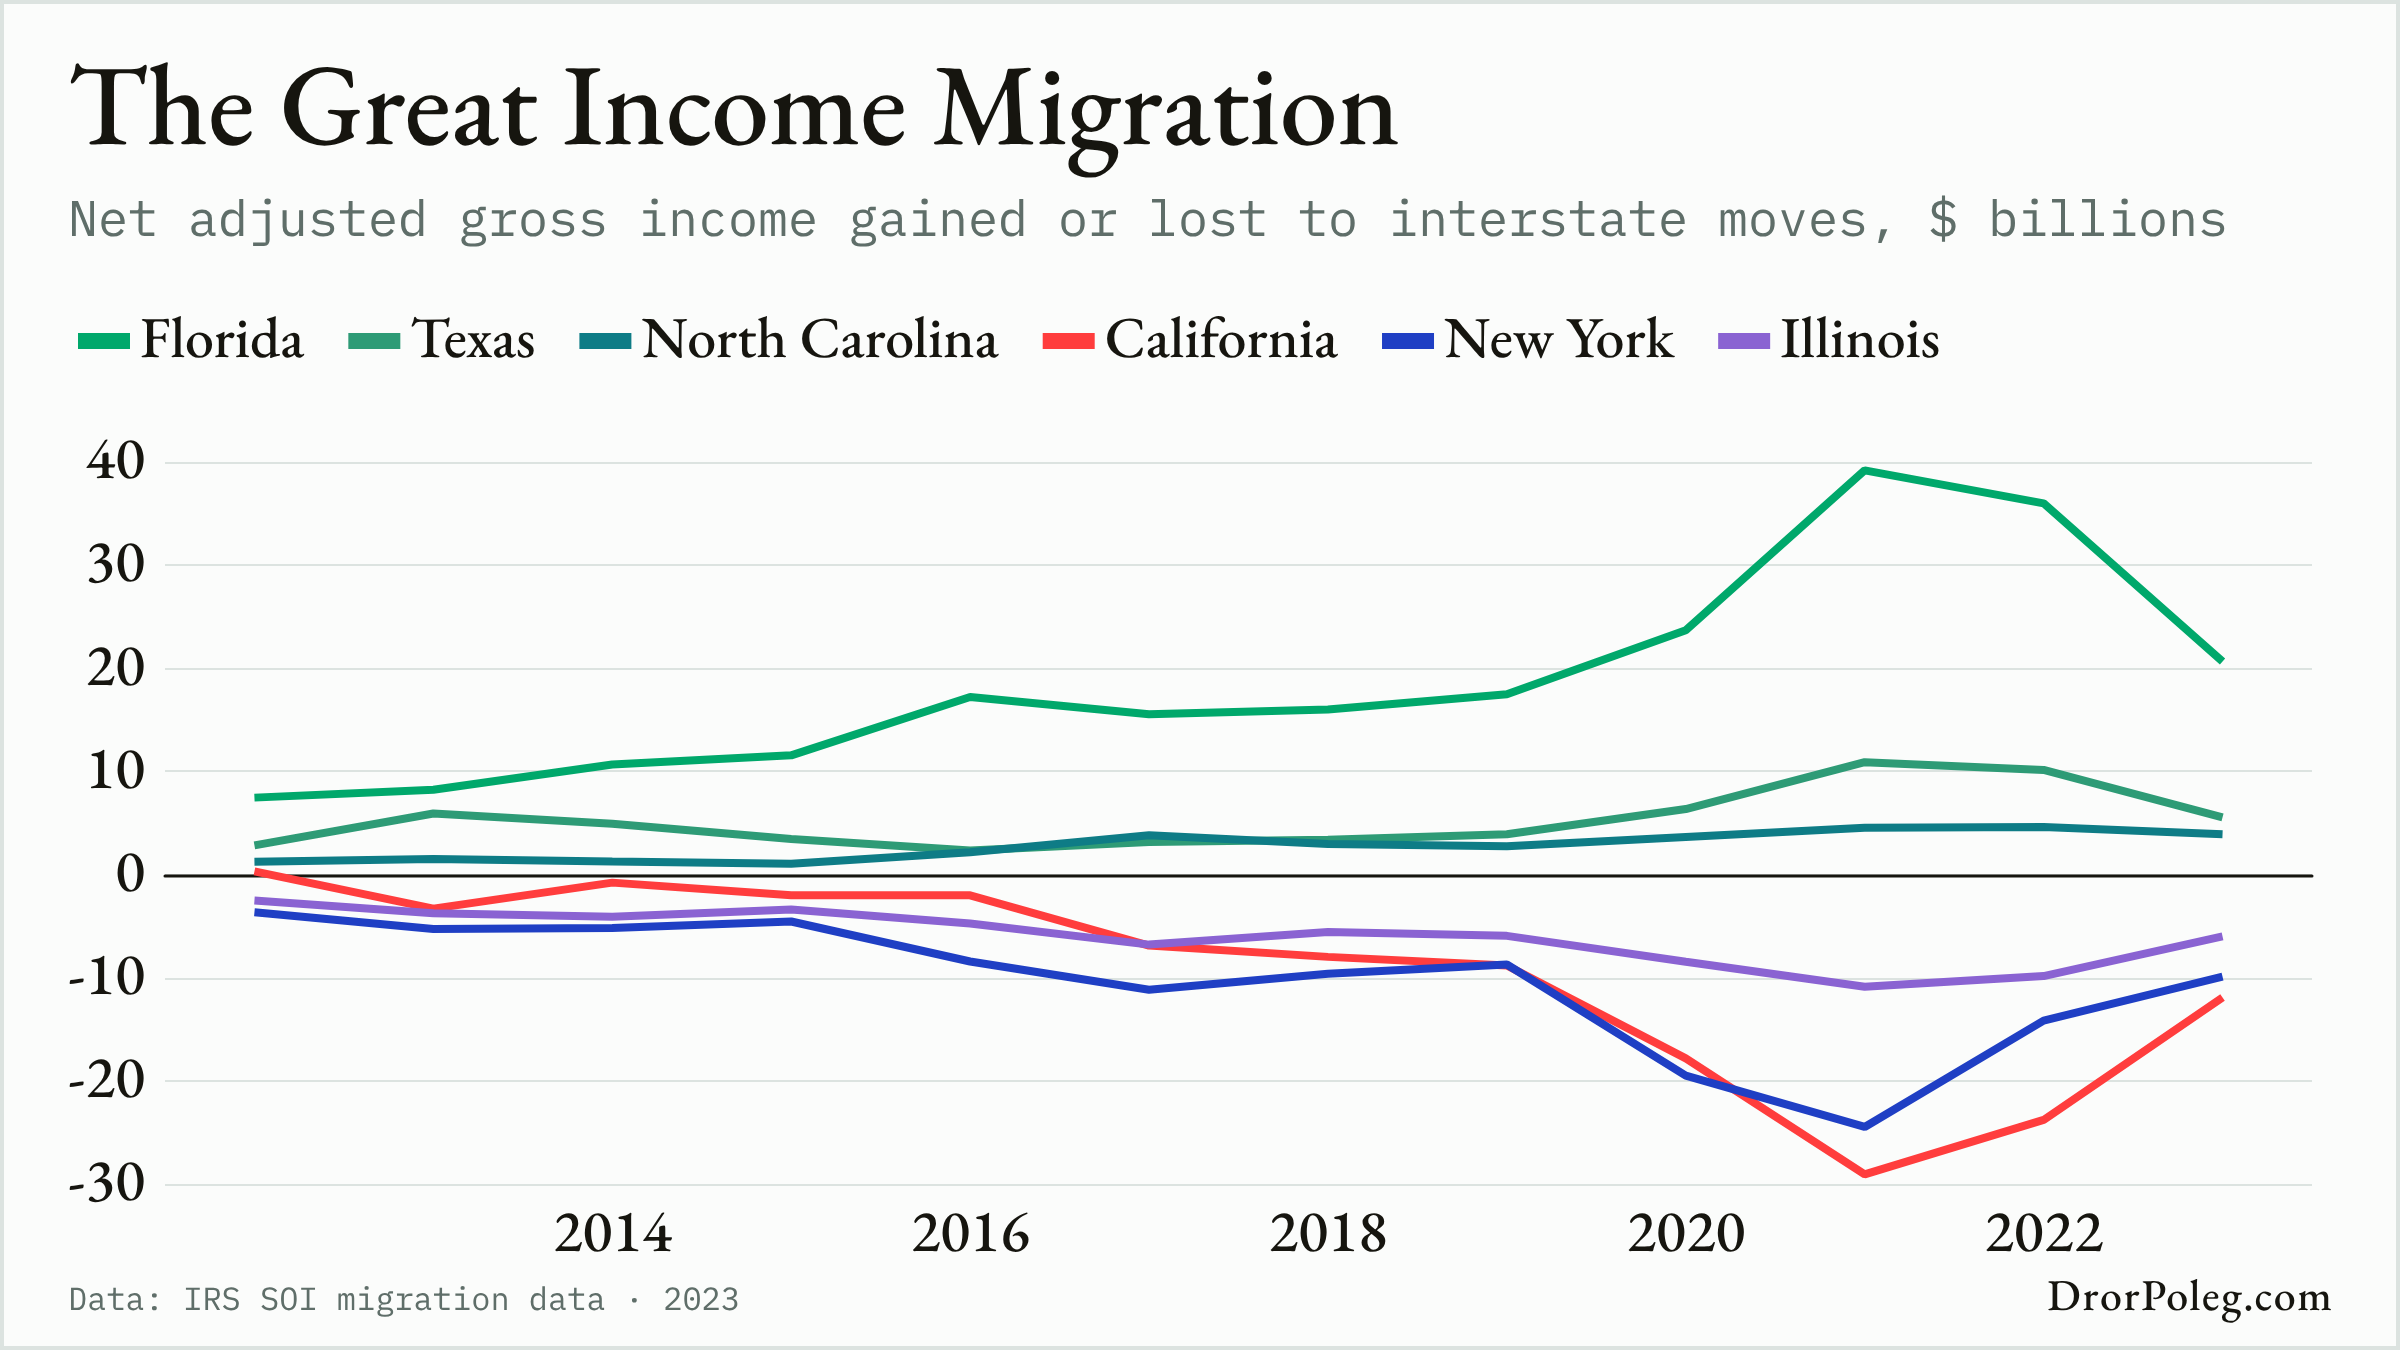
Deep dive · This week
The American migration story told through tax returns and home values: billions of dollars of income changing states, the superstar-county exodus, the rich-mover premium — and the housing-market twist where migration's winners became the places prices fall.
Read the 7-chart story →